
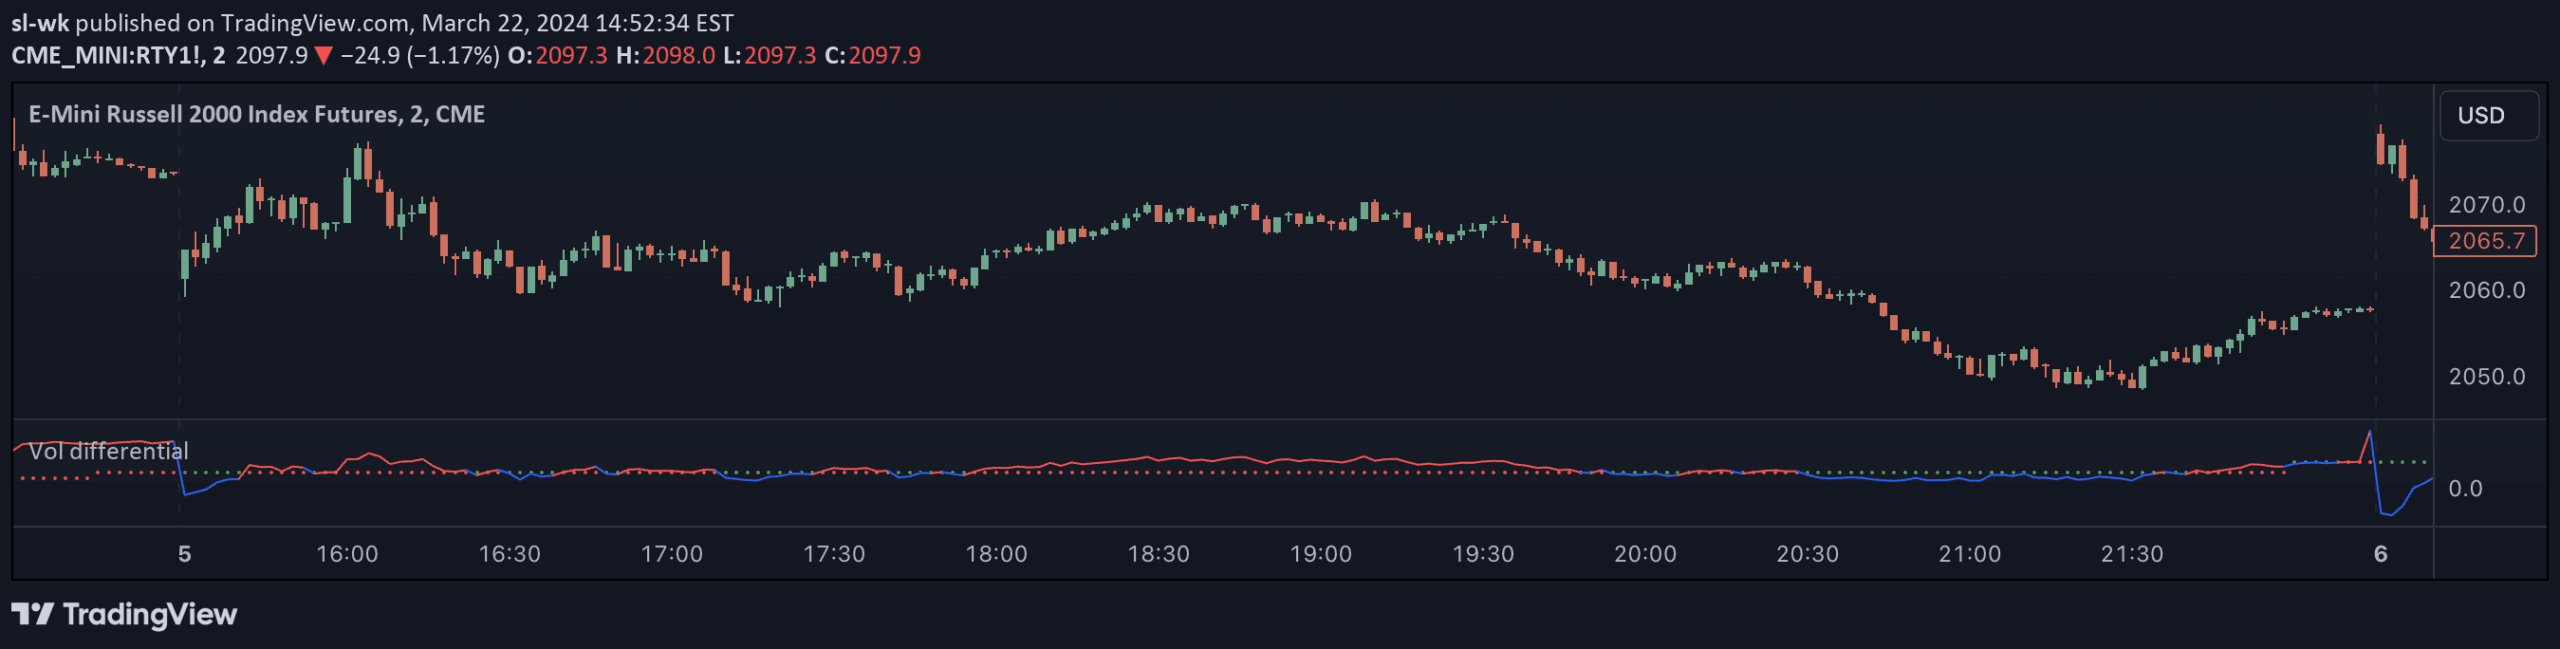
A volatility indicator comparing High-Low and Close-Close realized volatility to identify potential market movements and mean reversion opportunities in futures trading.
Explore complementary indicator rolesHow it works
The indicator calculates two primary volatility measurements: High-Low volatility and Close-Close volatility over a default 10-day period. It generates two key values - an average volatility difference and the current indicator value, which are plotted to provide insights into potential market volatility changes.
By comparing the current value against the average, traders can interpret potential volatility shifts. When the current value is lower than the average, it suggests High-Low volatility might increase, while a higher current value indicates potential volatility decrease.
Why it may be useful
Volatility measurements are crucial for understanding market dynamics and potential price movements. This indicator provides traders with a nuanced view of market volatility by comparing different volatility calculation methods, offering insights that can help inform trading decisions.
By highlighting potential volatility changes, the indicator helps traders anticipate market behavior, manage risk, and identify potential entry and exit points in futures contracts more effectively.
When to explore it
The indicator is most effective when used in conjunction with other trend and mean reversion strategies, particularly in futures markets. It works best when a primary strategy already suggests a market is in a mean reversion mode, providing additional confirmation for potential trade entries.
Traders should use this indicator during periods of market transition or when approaching significant price levels, as it can offer supplementary insights into potential volatility shifts and market momentum.
Keep exploring
What we’ve verified
Access, alerts and repainting behaviour have not been independently verified for this indicator. Check the creator’s current publication and settings.
General descriptions and classifications are recovered research. Verified details above identify the specific checks we have completed. Check the creator’s current publication for later changes.


