
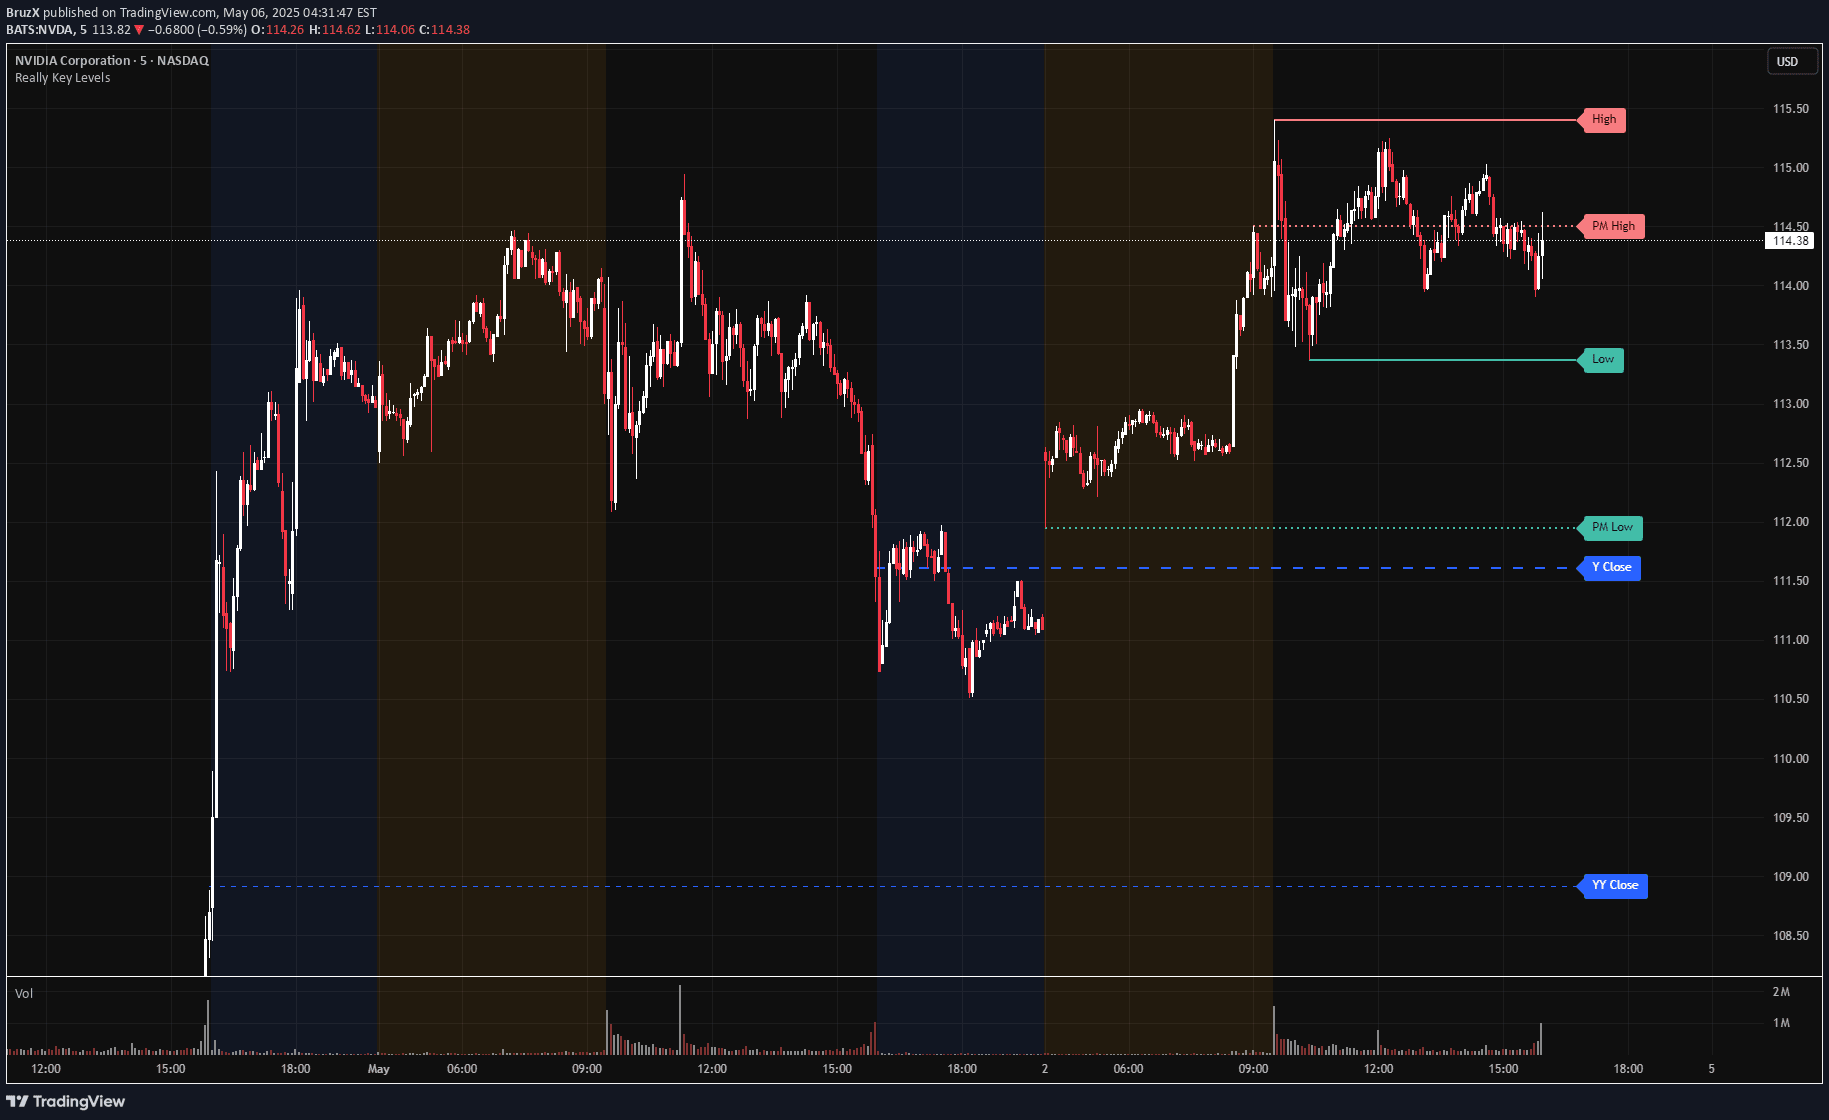
A trading indicator that dynamically displays key market levels like daily highs, lows, and opens across regular trading hours, pre-market, and post-market sessions.
Explore complementary indicator rolesHow it works
The indicator calculates and plots key trading levels by identifying specific bars that generate market-significant price points. It tracks multiple timeframes including current day regular trading hours (RTH), pre-market, and post-market sessions, marking important price levels like daily highs, lows, and opens.
Each level is represented by a configurable line starting from the specific bar that generates the level, allowing traders to visually understand price dynamics. The system is flexible, supporting both stock and futures markets, with user-configurable settings for line color, style, and extension.
Why it may be useful
Traders need clear, visual representations of market structure to make informed decisions, and this indicator provides exactly that by highlighting critical price levels. By showing key market points like daily highs, lows, and opens, it helps traders understand market context, potential support and resistance zones, and overall price dynamics.
The indicator's strength lies in its simplicity and focus on truly meaningful levels, avoiding cluttered displays that can overwhelm traders. Its ability to work across different markets and sessions makes it a versatile tool for understanding price behavior and potential trading opportunities.
When to explore it
This indicator is most effective during active trading sessions, particularly for day traders and those tracking intraday price movements. It provides maximum value during regular trading hours when price levels are most dynamic and meaningful, helping traders identify potential entry and exit points.
Traders can leverage these levels during trend identification, breakout strategies, and understanding market sentiment. It's particularly useful in volatile markets where understanding recent price structure can provide critical insights into potential future price movements.
Keep exploring
What we’ve verified
Access, alerts and repainting behaviour have not been independently verified for this indicator. Check the creator’s current publication and settings.
General descriptions and classifications are recovered research. Verified details above identify the specific checks we have completed. Check the creator’s current publication for later changes.


