
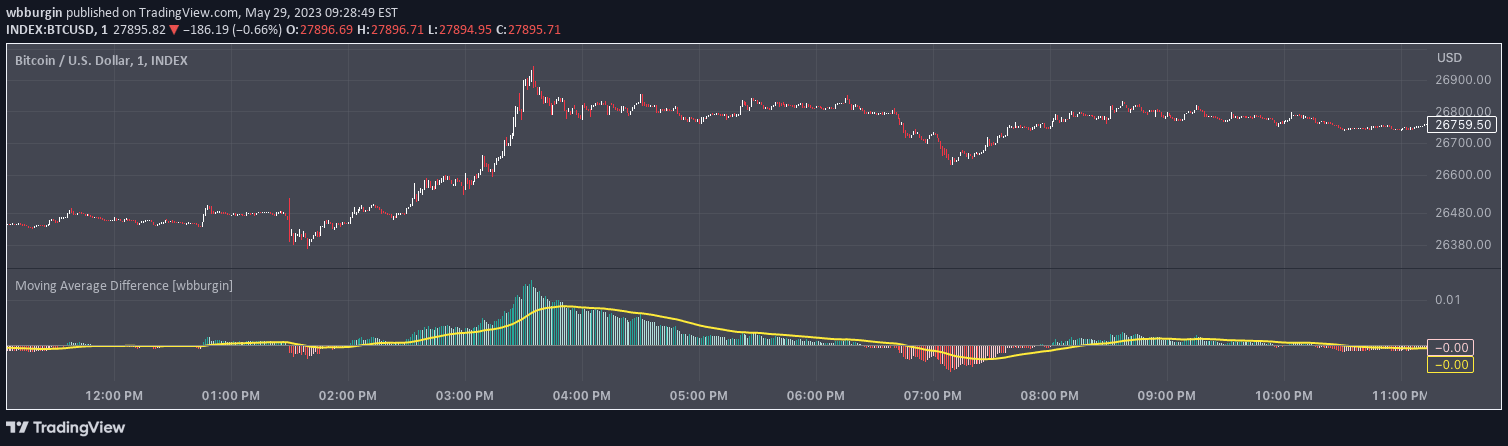
A technical indicator that calculates weighted moving average differences to reveal price trajectory and potential trend direction by comparing multiple moving average lengths.
Explore complementary indicator rolesHow it works
The indicator recursively calculates differences between multiple simple moving averages of different lengths, creating a comprehensive view of price movement dynamics. By selecting a minimum and maximum moving average length and an increment, traders can generate a weighted average of these differences, which represents the gradient of motion between various moving averages.
The calculation involves comparing each moving average's relationship to price and then weighing these differences based on their respective lengths. This approach allows traders to understand the path of least resistance in price movement, providing insights into potential trend directions and momentum shifts across different timeframes.
Why it may be useful
Understanding the relative positioning of price against multiple moving averages helps traders gain a more nuanced perspective on market trends and potential reversals. By aggregating moving average differences, traders can identify subtle shifts in momentum that might not be apparent when using a single moving average.
The weighted approach provides a more sophisticated analysis of price movement, reducing the impact of noise and offering a smoother representation of market dynamics. This method can help traders make more informed decisions by revealing underlying trend strength and potential future price behavior.
When to explore it
This indicator is most effective in markets with clear trending characteristics, where price movement shows consistent directional momentum across multiple timeframes. It works particularly well in liquid markets with sufficient price data to generate meaningful moving average comparisons.
Traders should utilize this signal when seeking to confirm trend direction, identify potential pullbacks, or detect early signs of trend breakdown. It is especially useful in volatile markets where traditional single moving average indicators might provide less reliable signals.
Keep exploring
What we’ve verified
Access, alerts and repainting behaviour have not been independently verified for this indicator. Check the creator’s current publication and settings.
General descriptions and classifications are recovered research. Verified details above identify the specific checks we have completed. Check the creator’s current publication for later changes.


