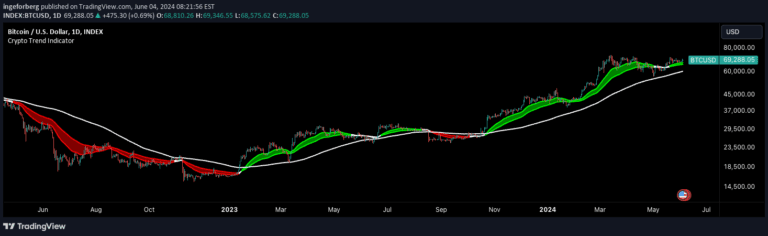
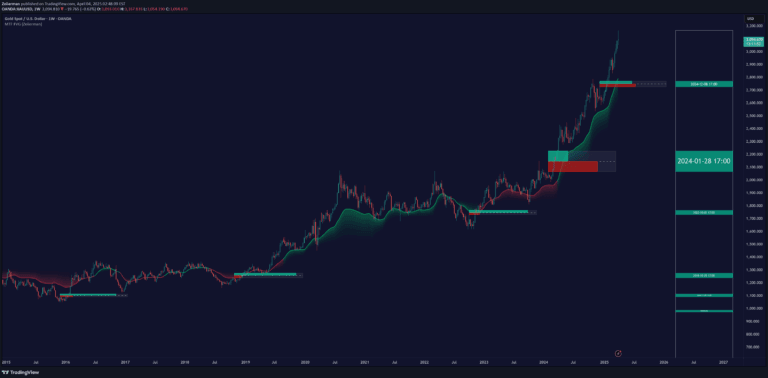
A multi-timeframe trend analysis tool that creates a synthetic trend line using SMEMA across six different timeframes, providing a comprehensive market direction assessment.
Explore complementary indicator rolesHow it works
The SMEMA Trend Core calculates a Simple Moving Average applied to an Exponential Moving Average across six different timeframes: 1H, 4H, 1D, 3D, 1W, and 1M. These timeframe calculations are dynamically weighted based on the selected trading mode, with short-term modes emphasizing 1H and 4H, while long-term modes prioritize 1W and 1M.
The indicator then synthesizes these calculations into a Global SMEMA trend line that adapts to market conditions. A Trend Score is calculated by measuring the price's position relative to the Global SMEMA, scaled by a long-term Average True Range (ATR) and adjusted by the trend line's slope, ultimately providing a normalized score between -10 and +10.
Why it may be useful
The SMEMA Trend Core offers traders a comprehensive and adaptive view of market trends by integrating multiple timeframe perspectives. By avoiding tunnel vision and incorporating data from six different resolutions, the indicator provides a more robust and nuanced understanding of market direction than single-timeframe analysis.
The quantified Trend Score and color-coded trend states (green for bullish, red for bearish, brown for neutral) enable traders to quickly assess market conditions. The optional deviation bands further enhance market context by highlighting potential support, resistance, and extended price movement zones.
When to explore it
The SMEMA Trend Core is most effective for traders seeking a holistic market analysis tool that transcends short-term noise and provides a structured trend perspective. It is particularly valuable for day traders and swing traders who need a reliable framework for understanding market structure and directional bias.
Traders should leverage this indicator for confirming trade setups, filtering potential trades, and gaining insight into the broader market trend cycle. It is especially useful during trending markets and can help traders avoid false signals by providing a multi-timeframe view of market momentum.
Keep exploring
What we’ve verified
Access, alerts and repainting behaviour have not been independently verified for this indicator. Check the creator’s current publication and settings.
General descriptions and classifications are recovered research. Verified details above identify the specific checks we have completed. Check the creator’s current publication for later changes.