
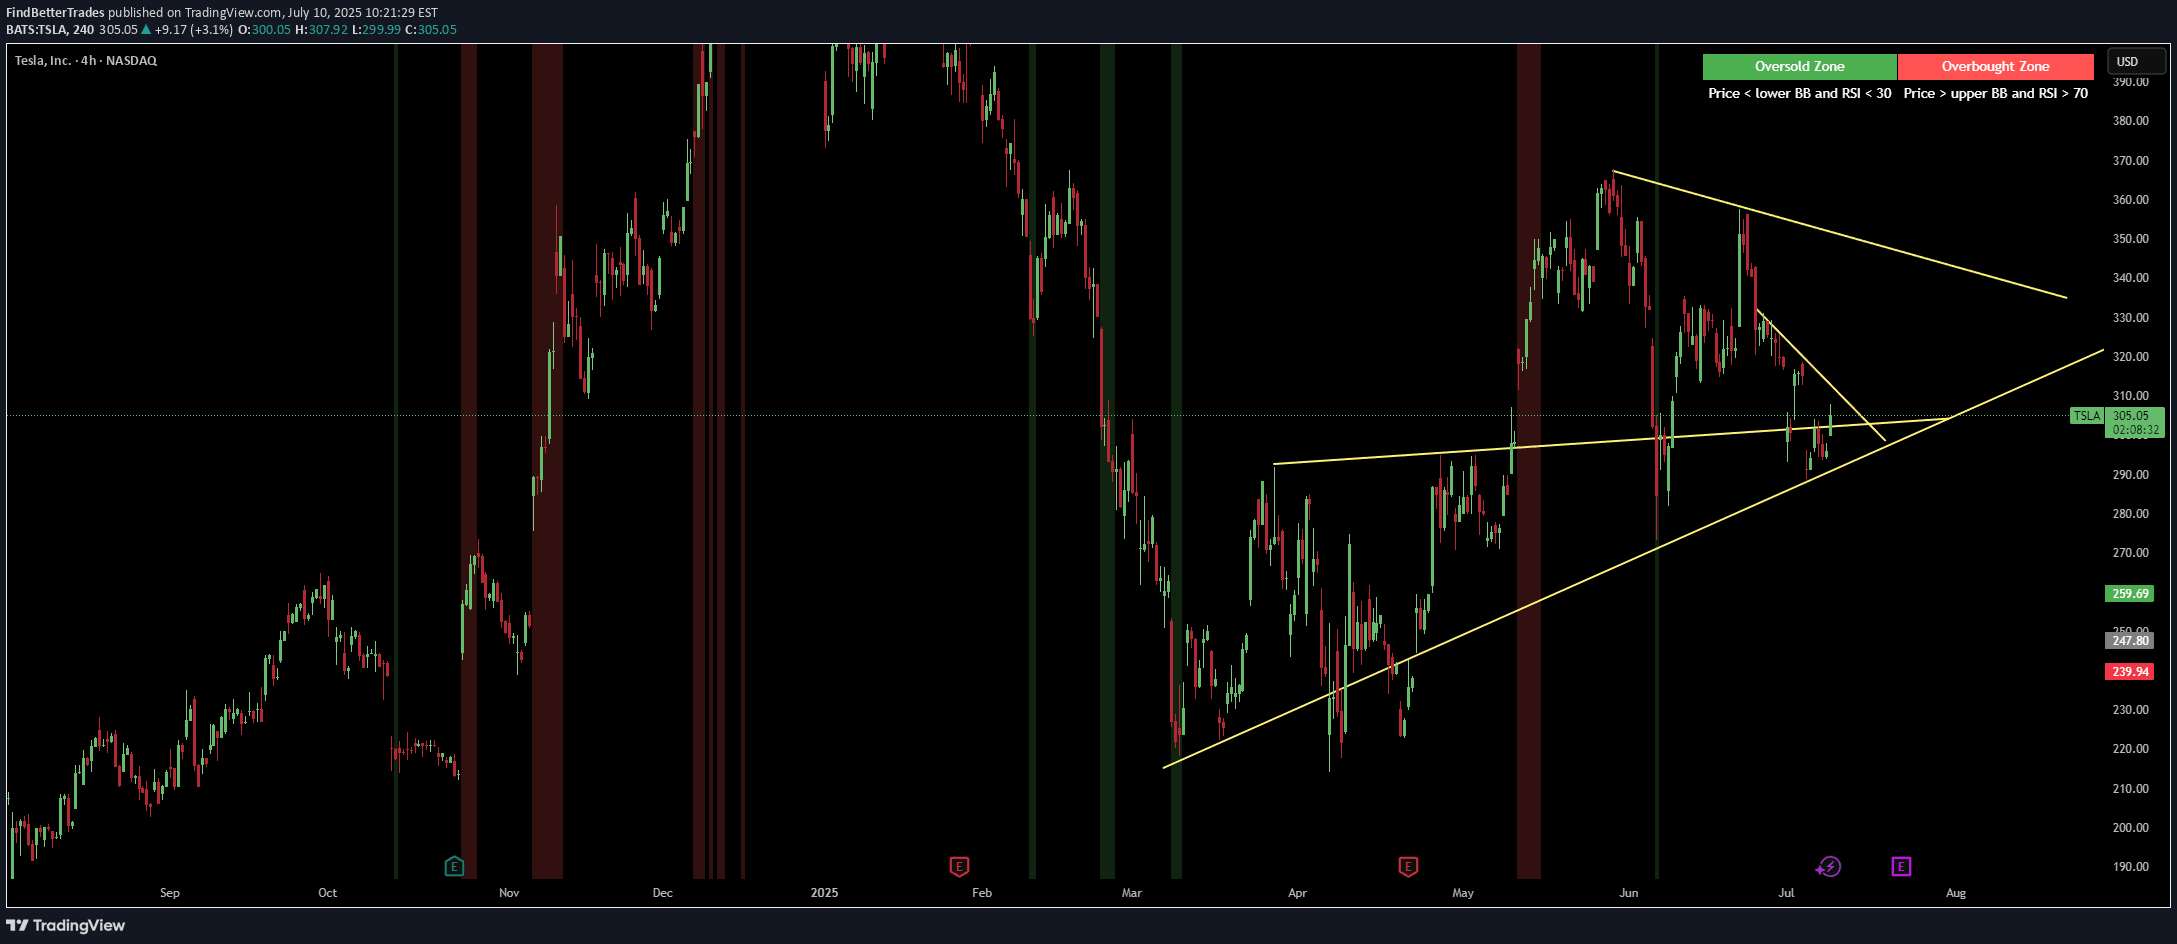
A chart overlay indicator using Bollinger Bands and RSI to identify potential market reversals by highlighting overbought and oversold conditions with color-coded zones.
Explore complementary indicator rolesHow it works
The Red & Green Zone Reversal indicator combines two powerful technical analysis tools: Bollinger Bands and the Relative Strength Index (RSI). It calculates a 20-period simple moving average with a 2.0 standard deviation multiplier to create the Bollinger Bands, which form dynamic price channels above and below the central moving average.
Simultaneously, the indicator computes a 14-period RSI to measure momentum and identify extreme market conditions. When the price moves outside the Bollinger Bands and the RSI crosses specific thresholds (below 30 or above 70), the indicator triggers visual alerts through color-coded backgrounds - red for oversold and green for overbought scenarios.
Why it may be useful
The Red & Green Zone Reversal indicator provides traders with a powerful visual tool to quickly identify potential market turning points. By combining price channel analysis with momentum measurement, it offers a comprehensive approach to detecting extreme market conditions that might signal imminent trend reversals.
This multi-dimensional analysis helps traders recognize potential entry or exit points more effectively than using a single indicator. The color-coded zones and alert system make it easy to spot critical market moments, reducing the cognitive load of manual chart analysis and potentially improving trading decision-making.
When to explore it
The Red & Green Zone Reversal indicator is most effective in markets with clear trending or ranging characteristics. It works particularly well in liquid markets with consistent price movements, such as major forex pairs, large-cap stocks, and prominent cryptocurrency pairs. Traders should ideally use this indicator in conjunction with other technical and fundamental analysis tools.
The signal is especially valuable during periods of market volatility or when assets appear to be experiencing momentum shifts. Traders should pay special attention to the indicator's signals during key economic events, earnings releases, or when there are significant changes in market sentiment that might trigger potential trend reversals.
Keep exploring
What we’ve verified
Access, alerts and repainting behaviour have not been independently verified for this indicator. Check the creator’s current publication and settings.
General descriptions and classifications are recovered research. Verified details above identify the specific checks we have completed. Check the creator’s current publication for later changes.


