
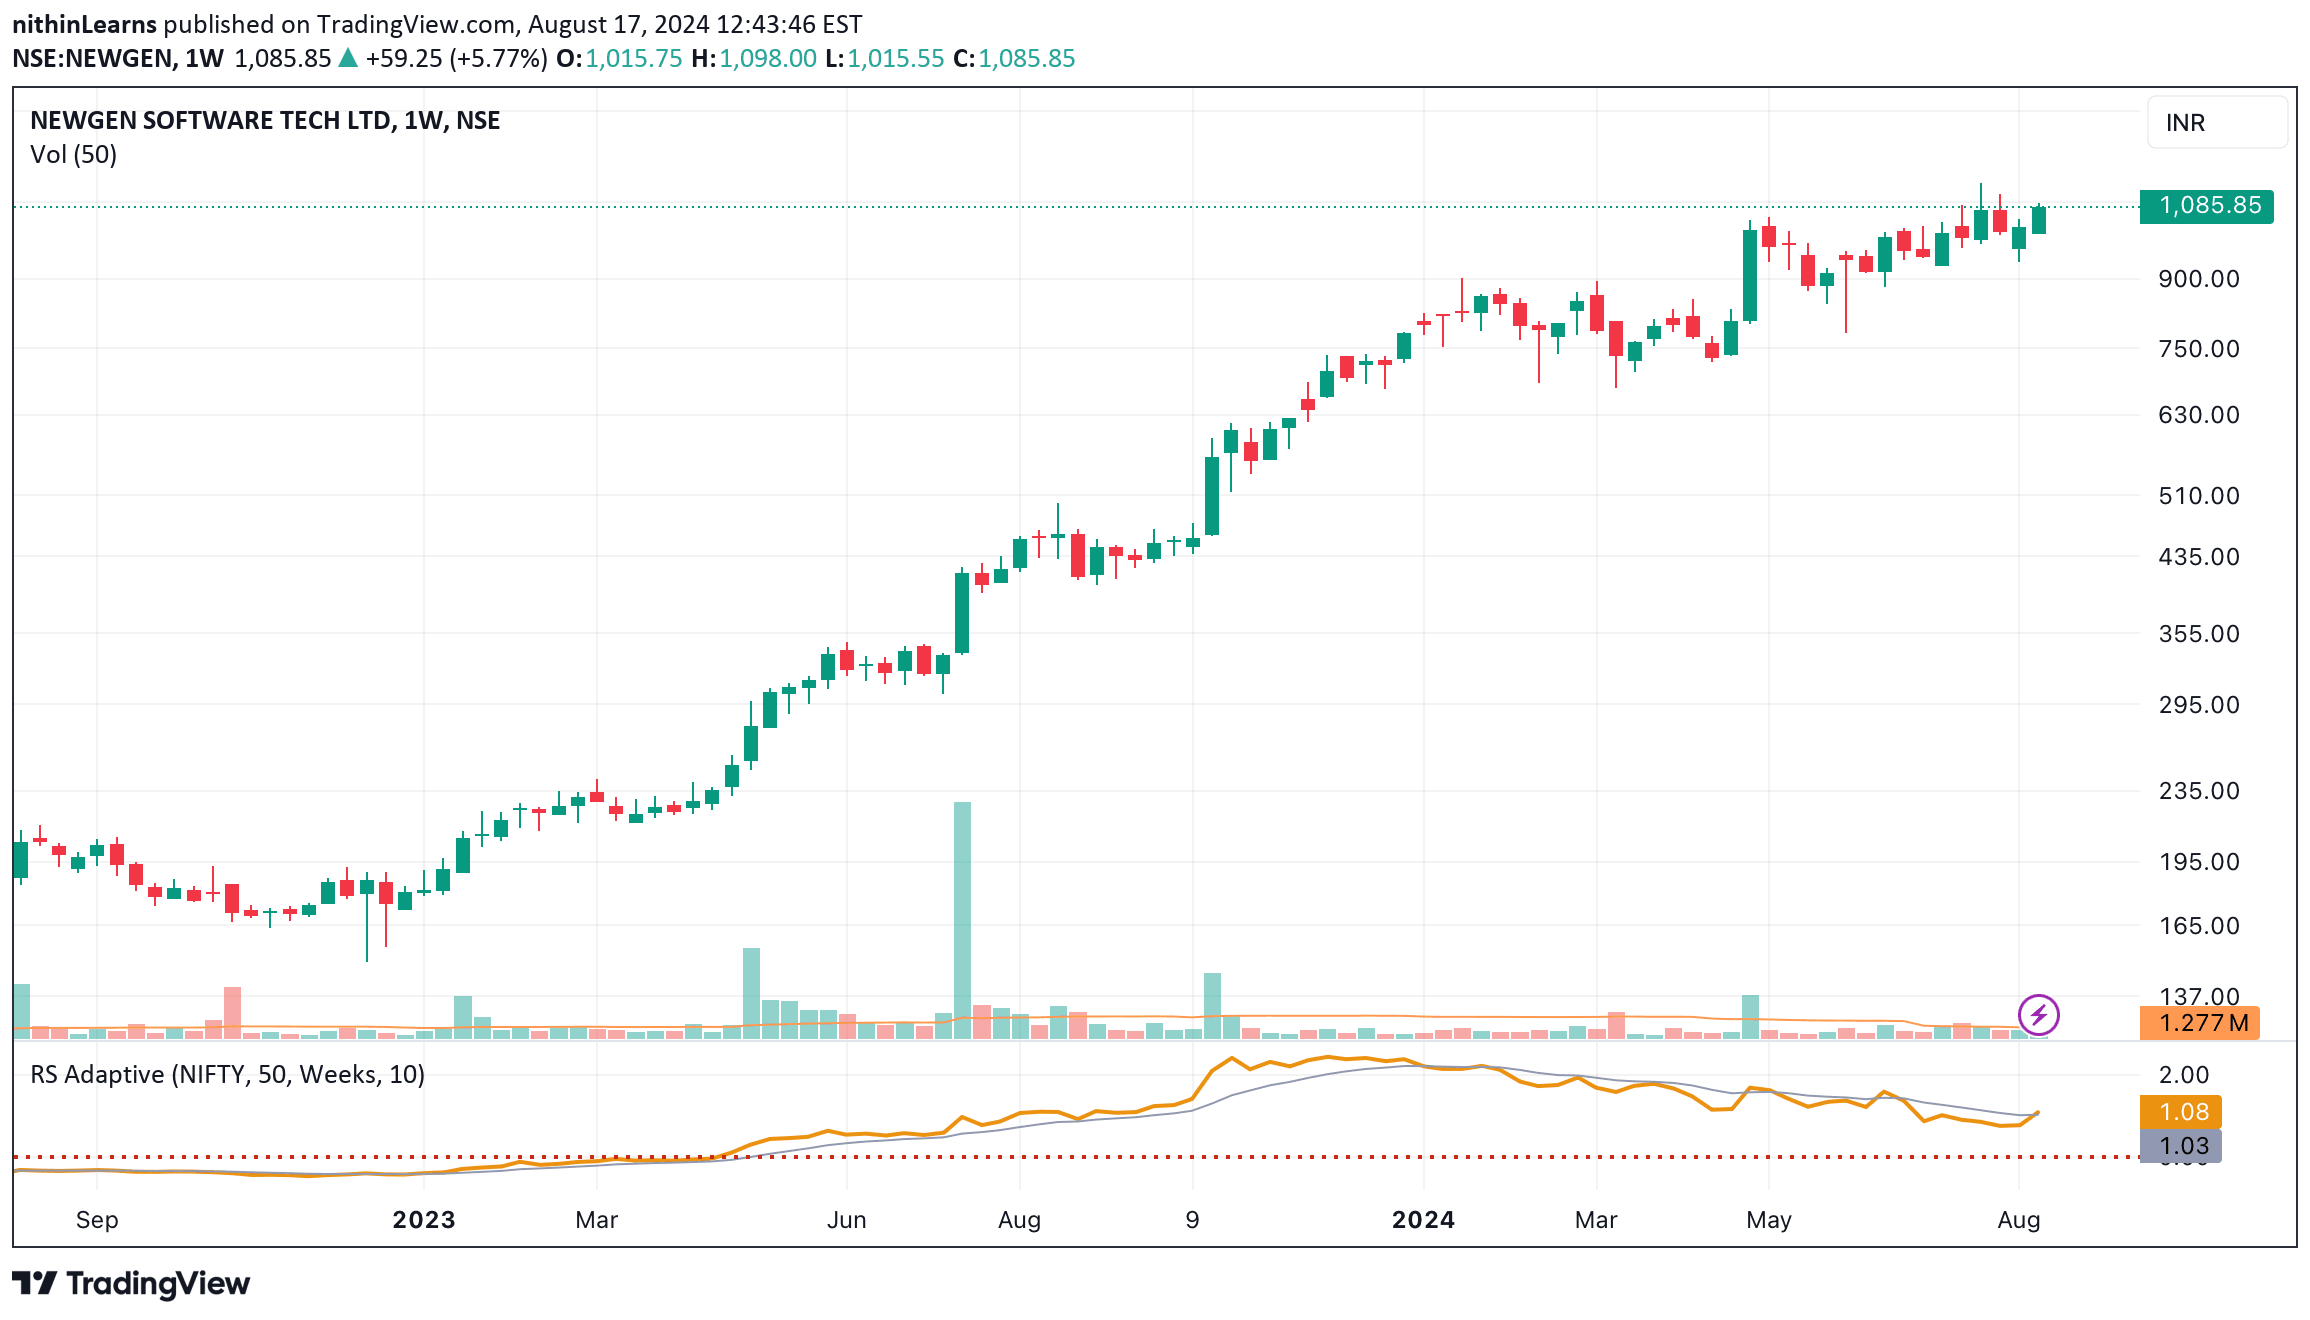
A relative strength indicator comparing a stock's performance against a market index, showing outperformance or underperformance through a zero-line oscillating metric.
Explore complementary indicator rolesHow it works
The Relative Strength Indicator calculates performance by dividing the percentage changes of a stock against a comparative symbol like a market index. It automatically adjusts the comparison period based on the chart's timeframe, ensuring adaptive and flexible analysis.
When the indicator's value is above zero, it signals that the stock has outperformed the comparative symbol, while values below zero indicate underperformance. The indicator can dynamically handle different timeframes and adjust its calculation period if the stock has fewer bars than the comparative period.
Why it may be useful
This indicator provides traders with a clear, quantitative method to evaluate a stock's performance relative to a broader market benchmark. By comparing percentage changes, it offers insights into whether a stock is stronger or weaker than the overall market, which can help inform investment and trading decisions.
The automatic period adjustment and flexible comparison make this tool particularly valuable for traders seeking a dynamic and adaptable performance measurement tool. It eliminates manual calculations and provides an easy-to-interpret visual representation of relative market strength.
When to explore it
The Relative Strength Indicator is most effective when analyzing stocks within the context of a broader market index, such as comparing individual stocks against Nifty or S&P 500. It works best for traders looking to understand comparative performance across daily, weekly, or monthly timeframes.
Traders can utilize this indicator during trend identification, portfolio allocation, and when seeking stocks that are outperforming or underperforming the market. It's particularly useful for swing traders and day traders who want to make data-driven decisions based on relative market performance.
Keep exploring
What we’ve verified
Access, alerts and repainting behaviour have not been independently verified for this indicator. Check the creator’s current publication and settings.
General descriptions and classifications are recovered research. Verified details above identify the specific checks we have completed. Check the creator’s current publication for later changes.


