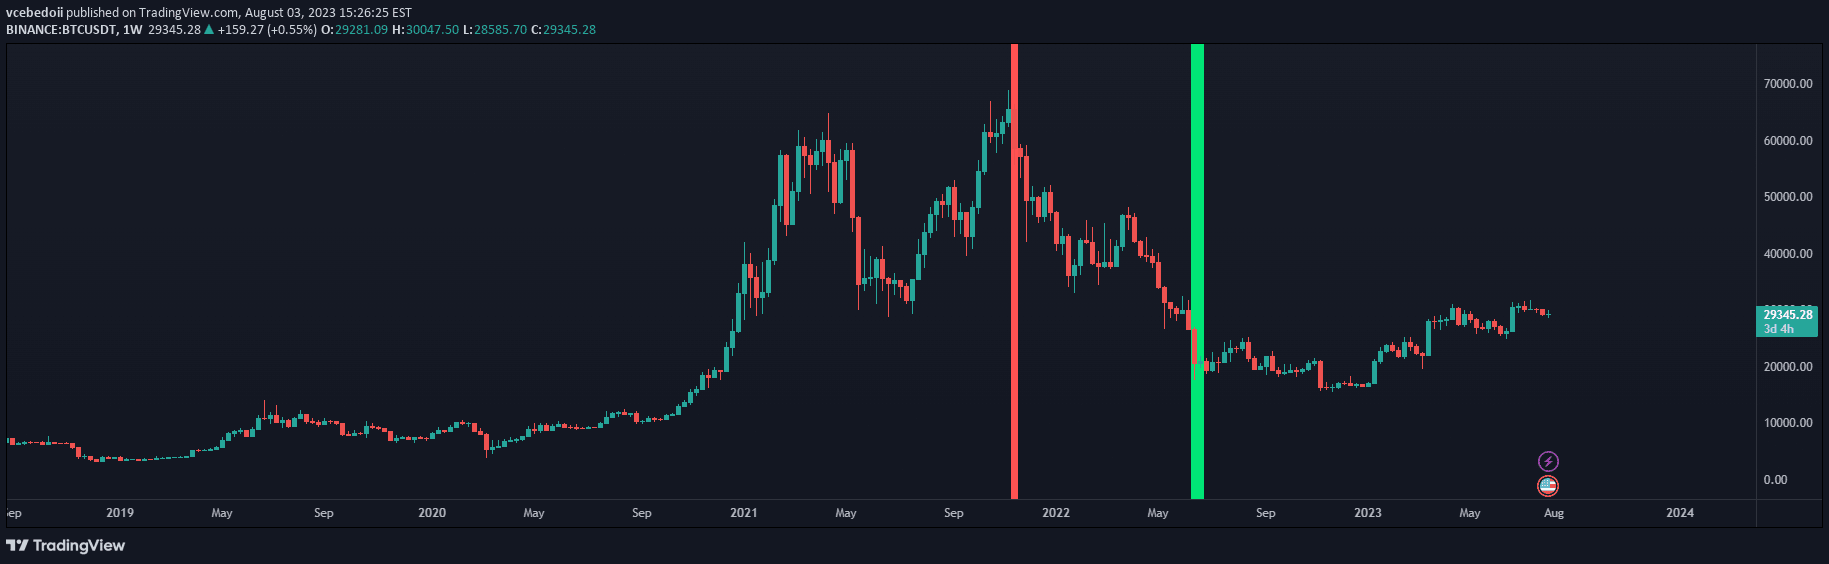
A stationarity analysis tool that examines price returns, moving averages, z-scores, and autocorrelation to identify potential changes in stock price dynamics.
Explore complementary indicator rolesHow it works
The stationarity indicator begins by calculating daily price returns, which represent the percentage change in a stock's closing price. It then computes a simple moving average to smooth out the returns and reveal underlying trends, providing a clearer view of price movement patterns.
The indicator further analyzes the returns by calculating a z-score, which standardizes the data and highlights periods of significant deviation from the mean. Additionally, it generates an autocorrelation plot to measure the persistence or 'memory' in the time series, helping traders understand the consistency and predictability of price movements.
Why it may be useful
Understanding the stationarity of price returns is crucial for developing robust trading strategies and making informed investment decisions. By revealing the statistical properties of a stock's price behavior, traders can gain insights into the underlying market dynamics and potential future price movements.
The indicator helps identify periods of stability and instability, which can be critical for risk management and forecasting. Traders can use this information to adjust their strategies, recognize when traditional statistical methods might be less reliable, and develop more sophisticated approaches to market analysis.
When to explore it
The stationarity indicator is most effective when analyzing stocks with potentially changing price dynamics or during periods of market transition. It is particularly useful for traders seeking to understand the underlying statistical characteristics of a stock's price movement before implementing complex trading strategies.
Traders should consider using this indicator when evaluating new investment opportunities, assessing market regime changes, or looking to validate the assumptions of their existing trading models. It is especially valuable during volatile market conditions or when analyzing stocks with complex price behavior patterns.
Keep exploring
What we’ve verified
Access, alerts and repainting behaviour have not been independently verified for this indicator. Check the creator’s current publication and settings.
General descriptions and classifications are recovered research. Verified details above identify the specific checks we have completed. Check the creator’s current publication for later changes.