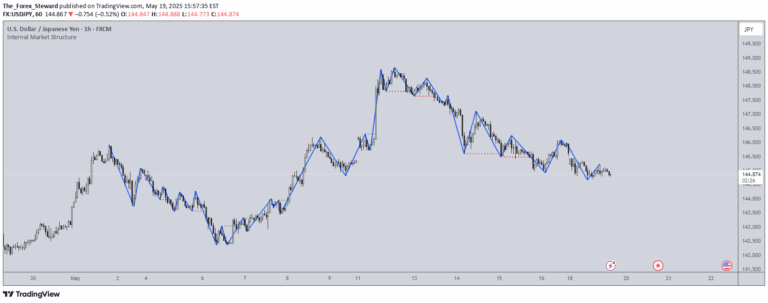
A trading signal that identifies potential price reversals by analyzing false breakouts of support and resistance levels through range and position analysis of price bars.
Explore complementary indicator rolesHow it works
The signal works by analyzing price bar characteristics within a specified lookback period. It calculates the highest high and lowest low of prior bars and computes a simple moving average of the bar ranges.
Using a range multiple and range threshold, it filters and identifies bars that potentially signal a reversal. The indicator focuses on bars where the price briefly breaks a support or resistance level but closes back within the original range, suggesting a false breakout and potential trend reversal
Why it may be useful
This signal helps traders identify potential market reversals by highlighting false breakouts. By examining price bar characteristics and range dynamics, traders can gain insights into market sentiment and potential trend changes.
The signal provides a visual tool to recognize moments when price breaks a level but fails to sustain the movement, which could indicate a lack of true momentum. This can help traders make more informed decisions about entry and exit points
When to explore it
The signal works best in ranging or consolidating markets where false breakouts are more common. It is particularly useful for traders looking to identify potential trend reversals or moments of market indecision.
The indicator is most effective when combined with other technical analysis tools and when market volatility is moderate. Traders should adjust the lookback period, range multiple, and range threshold settings to suit different market conditions and asset types
Keep exploring
What we’ve verified
Access, alerts and repainting behaviour have not been independently verified for this indicator. Check the creator’s current publication and settings.
General descriptions and classifications are recovered research. Verified details above identify the specific checks we have completed. Check the creator’s current publication for later changes.