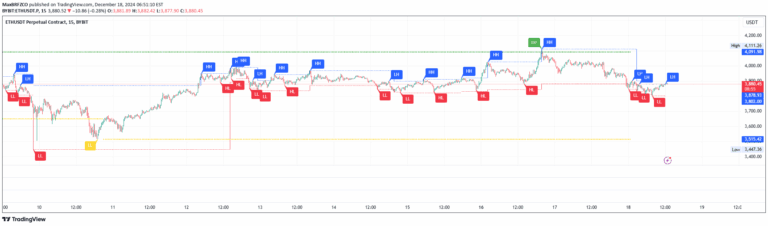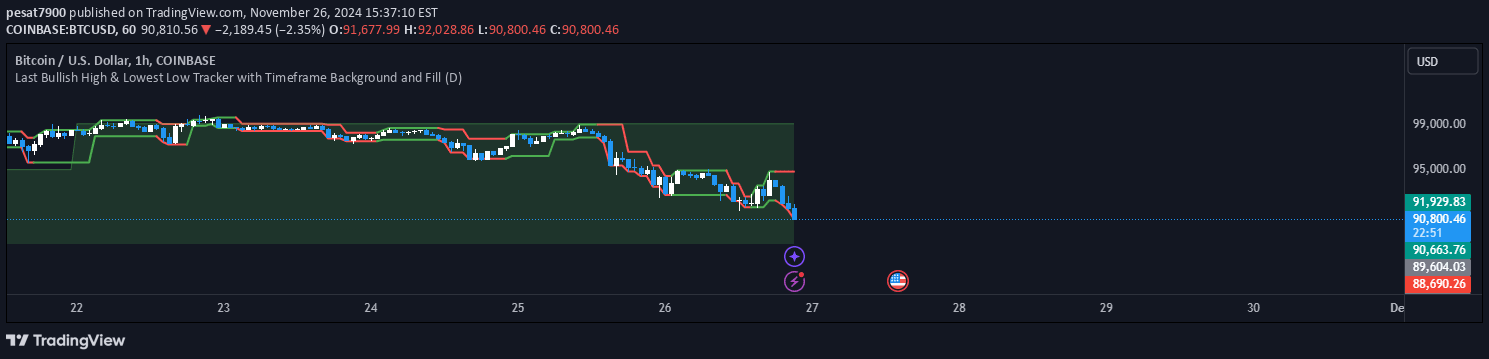
A multi-timeframe trend tracking indicator that visualizes bullish and bearish price trends through dynamic lines, area fills, and background coloring across different timeframes.
Explore complementary indicator rolesHow it works
The indicator dynamically tracks bullish highs and bearish lows on both the current chart and a selected timeframe. It identifies price levels after green (bullish) and red (bearish) candles, plotting corresponding lines and creating visual representations of trend movements.
By comparing lines and colors between the current and selected timeframes, traders can quickly understand trend alignments. The script uses color-coded lines, area fills, and background colors to represent bullish (green) and bearish (red) trend conditions, making trend analysis more intuitive and visually engaging.
Why it may be useful
This indicator simplifies complex multi-timeframe trend analysis by providing an immediate visual understanding of market direction. It helps traders quickly identify trend alignments, potential entry points, and market momentum across different timeframes without extensive manual calculations.
By presenting trend information through color-coded lines, fills, and backgrounds, the indicator reduces cognitive load and allows traders to make faster, more informed decisions. It bridges the gap between different timeframe perspectives, enabling traders to see broader market context and potential trend continuations or reversals.
When to explore it
The indicator is most effective during trending market conditions where clear directional movements are present. It works exceptionally well for traders seeking to confirm trend strength across multiple timeframes and identify potential trade entry or exit points based on trend alignment.
Traders can utilize this tool when transitioning between different timeframes, looking to validate trend consistency, or seeking visual confirmation of market sentiment. It is particularly useful for traders who want to combine technical analysis with a quick, intuitive visual representation of market dynamics.
Keep exploring
What we’ve verified
Access, alerts and repainting behaviour have not been independently verified for this indicator. Check the creator’s current publication and settings.
General descriptions and classifications are recovered research. Verified details above identify the specific checks we have completed. Check the creator’s current publication for later changes.