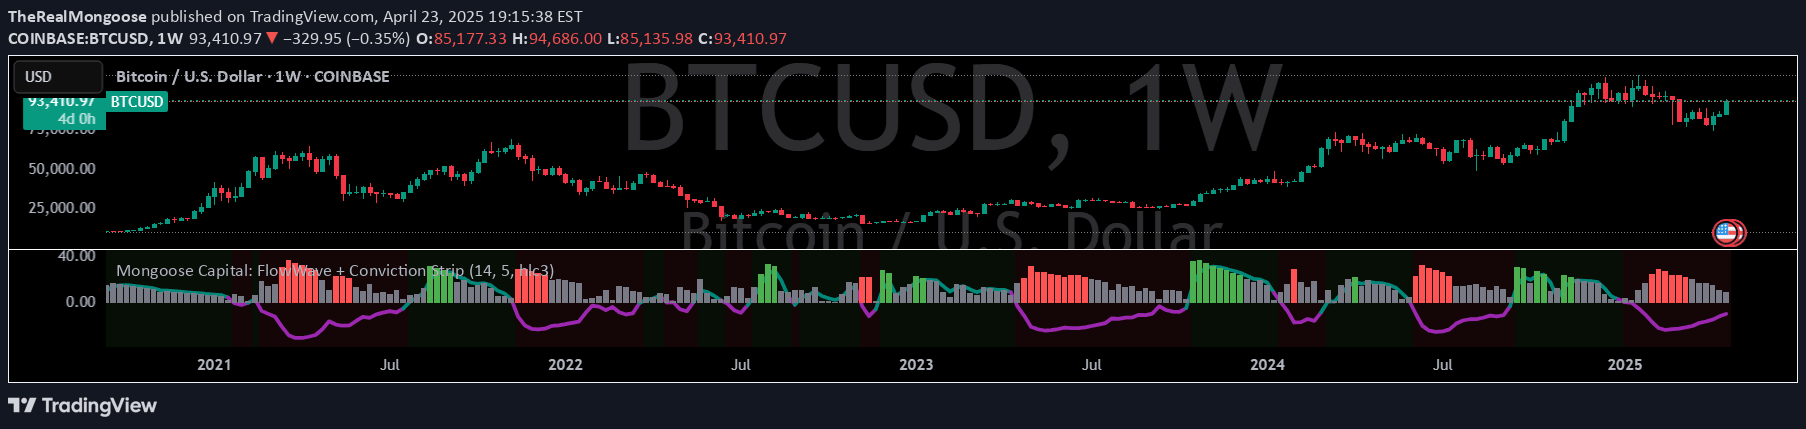
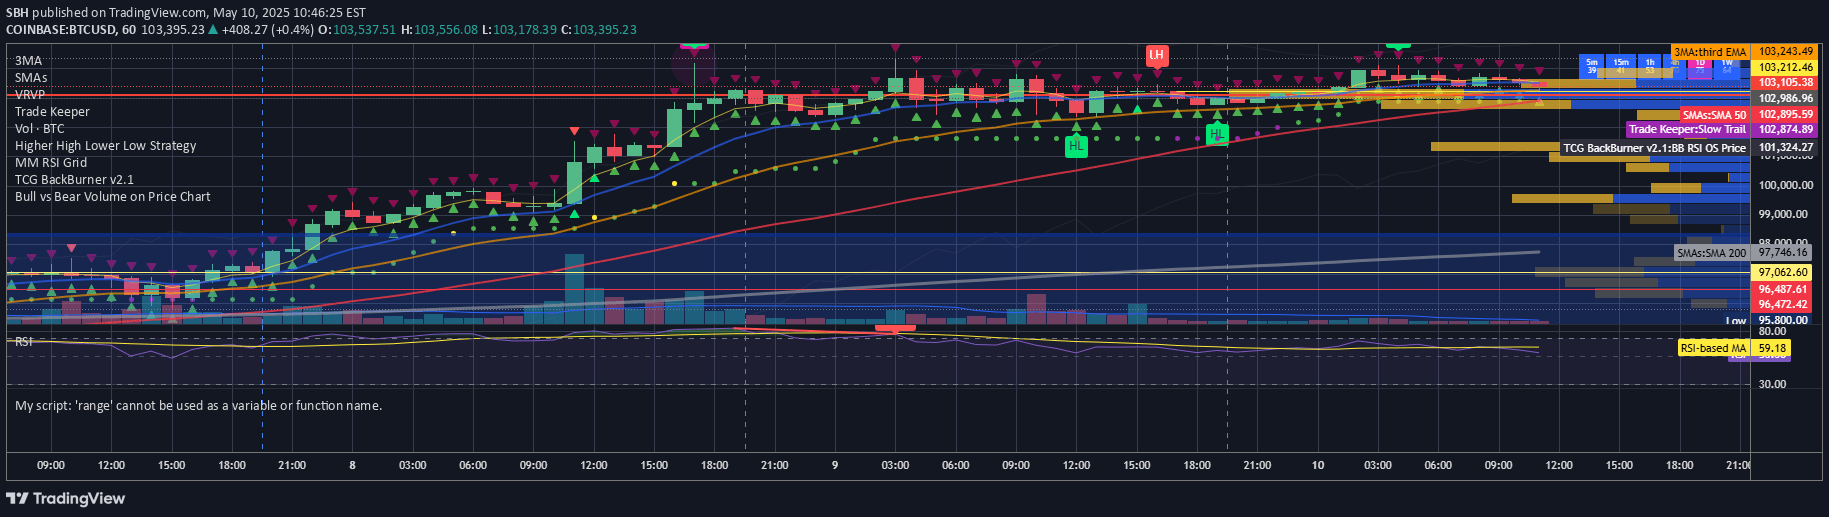
A rolling period summation script designed to aggregate price or volume data over a specified timeframe, enabling traders to analyze cumulative market movements and trends.
Explore complementary indicator rolesHow it works
The rolling period summation script calculates a cumulative total by adding together prices or volumes over a specified number of periods, typically 20 by default. It systematically moves through the dataset, creating a rolling window that computes the total value for each sequential period.
This method allows traders to track aggregate market movements, revealing underlying trends that might not be apparent from individual data points. By summing values over time, the script can help identify momentum, trend strength, and potential market shifts across different financial instruments and timeframes.
Why it may be useful
Rolling period summation provides traders with a comprehensive view of market dynamics by aggregating data over time, offering insights beyond single-period analysis. This approach helps smooth out short-term fluctuations and reveal more significant market trends and potential directional movements.
By understanding cumulative market behavior, traders can make more informed decisions about entry and exit points, risk management, and overall trading strategy. The flexibility of adjusting the rolling period allows for customized analysis across different market conditions and trading styles.
When to explore it
The rolling period summation script is most effective when analyzing markets with significant volume or price movements, such as stocks, cryptocurrencies, and forex. It works best in trending markets where cumulative data can reveal sustained momentum and directional strength.
Traders should apply this technique during periods of clear market trends, using it in conjunction with other technical indicators to confirm signals and validate potential trading opportunities. It is particularly useful for identifying longer-term market sentiment and filtering out short-term market noise.
Keep exploring
What we’ve verified
Access, alerts and repainting behaviour have not been independently verified for this indicator. Check the creator’s current publication and settings.
General descriptions and classifications are recovered research. Verified details above identify the specific checks we have completed. Check the creator’s current publication for later changes.