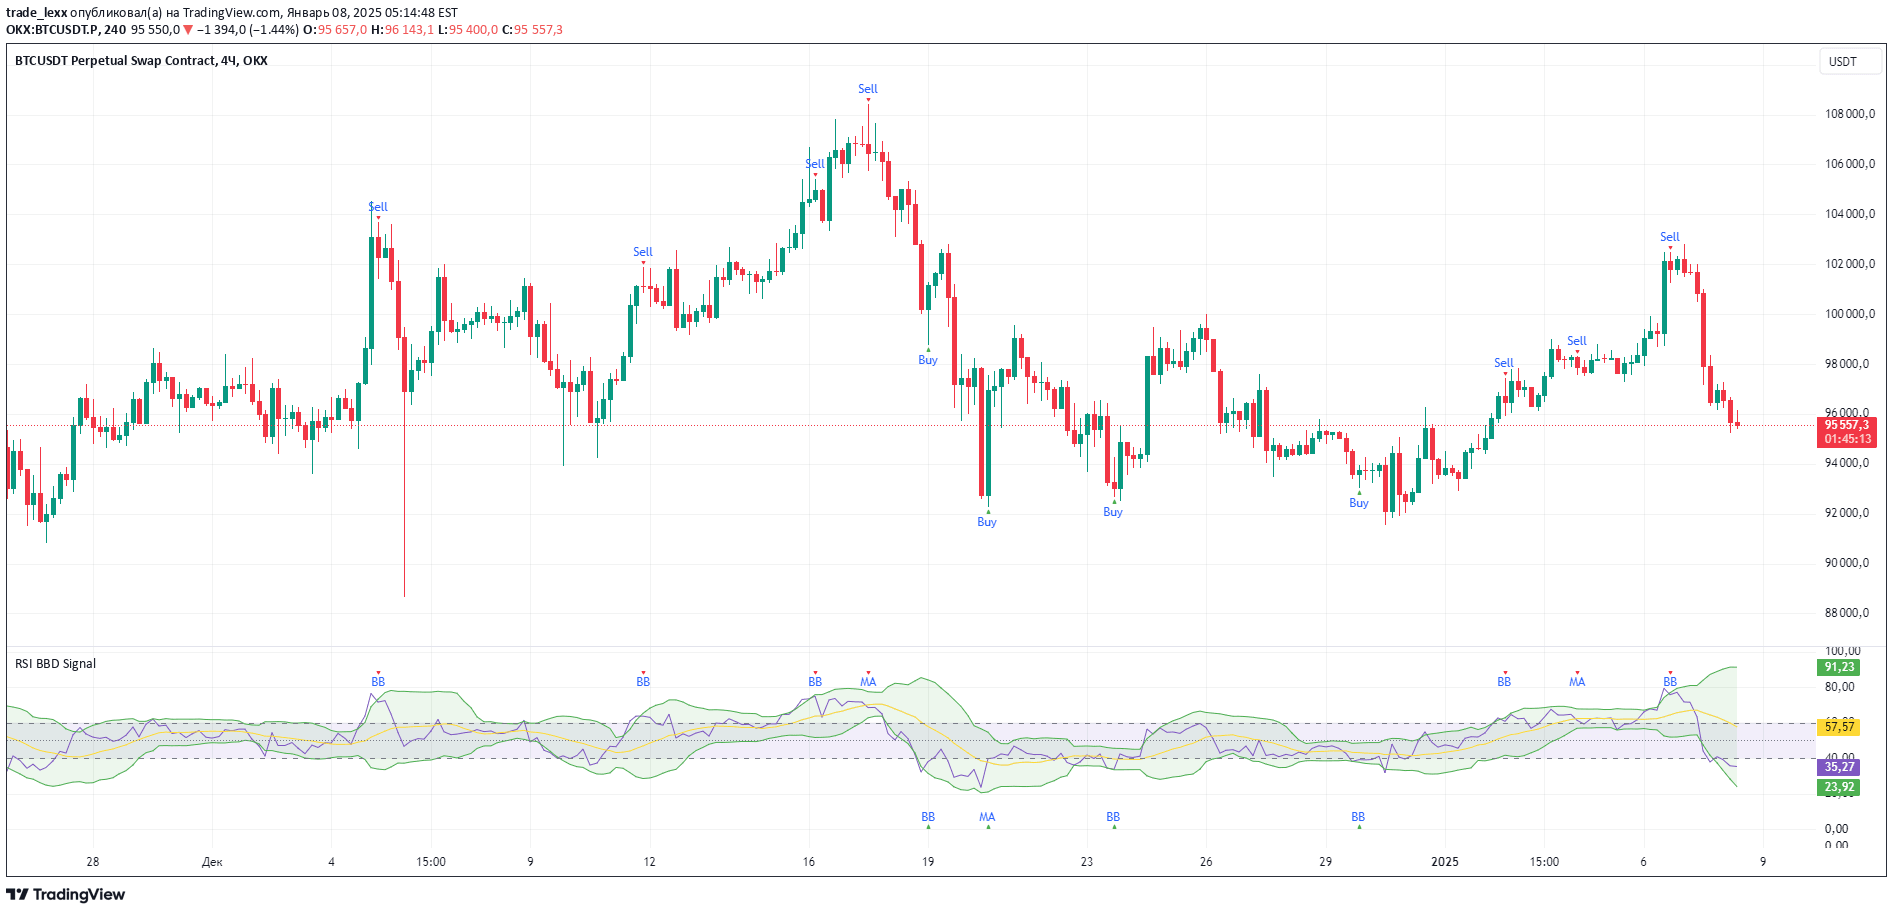
Seasonal RSI combines traditional Relative Strength Index with historical weekly performance data, providing traders enhanced insights into market conditions and potential price movements.
Explore complementary indicator rolesHow it works
The Seasonal RSI first calculates the traditional Relative Strength Index for a specified period, measuring price momentum and identifying potential overbought or oversold conditions. It then incorporates historical seasonality data by analyzing the win rates and average price changes for the current week of the year.
The indicator dynamically colors the RSI line based on these historical performance metrics, providing visual cues about potential market trends. A sophisticated algorithm maps the weekly win rates to color intensity, ranging from bright green for high-performance weeks to dark red for historically weak periods.
Why it may be useful
Traditional RSI provides valuable momentum insights, but the Seasonal RSI adds critical contextual information by integrating historical weekly performance data. This enhanced approach helps traders understand not just current momentum, but also the seasonal tendencies that might influence price movement.
By combining technical analysis with historical trend data, traders can reduce false signals and improve their decision-making process. The color-coded visualization and seasonality information table offer quick, actionable insights that can help traders align their strategies with proven historical patterns.
When to explore it
The Seasonal RSI is most effective for traders seeking to combine technical momentum analysis with seasonal market trends. It works particularly well for short-term and swing trading strategies where understanding weekly performance patterns can provide a competitive edge.
Traders should leverage this indicator during periods of market uncertainty or when looking to validate momentum signals with historical context. It is especially useful for markets with consistent seasonal patterns, such as stocks, commodities, or indices that demonstrate predictable weekly performance trends.
Keep exploring
What we’ve verified
Access, alerts and repainting behaviour have not been independently verified for this indicator. Check the creator’s current publication and settings.
General descriptions and classifications are recovered research. Verified details above identify the specific checks we have completed. Check the creator’s current publication for later changes.