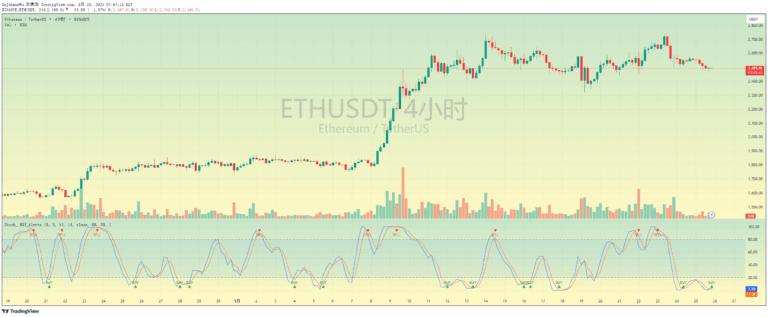
An advanced indicator combining RSI and Stochastics with probability analysis to predict potential stock price movements and identify high-probability trading opportunities.
Explore complementary indicator rolesHow it works
The indicator applies regression-based analysis on Stochastics and RSI to predict the most likely stock close price. It plots two smoothed lines representing Stochastic and RSI price predictions, with a yellow line for Stochastics and a white line for RSI.
When these lines cross, the indicator generates signals indicating potential bearish or bullish market movements. A bearish cross occurs when the Stochastic line crosses above the RSI line, while a bullish cross happens when the RSI line crosses above the Stochastic line.
Why it may be useful
This indicator provides traders with a sophisticated probabilistic approach to market analysis by combining multiple technical indicators. It helps traders understand the current trading zone, probability of price movement, and potential regression to the mean.
By offering both visual signals and a detailed data table, the indicator gives traders additional insights into market dynamics, helping them make more informed trading decisions with enhanced probability-based information.
When to explore it
The indicator works best in markets with clear trending or ranging conditions, where traditional momentum indicators can provide reliable signals. Traders should use it as a complementary tool alongside other technical and fundamental analysis methods.
It is particularly useful for identifying potential trend reversals, assessing market probabilities, and finding high-probability entry and exit points. Traders should exercise caution and not rely solely on this indicator for making trading decisions.
Keep exploring
What we’ve verified
Access, alerts and repainting behaviour have not been independently verified for this indicator. Check the creator’s current publication and settings.
General descriptions and classifications are recovered research. Verified details above identify the specific checks we have completed. Check the creator’s current publication for later changes.