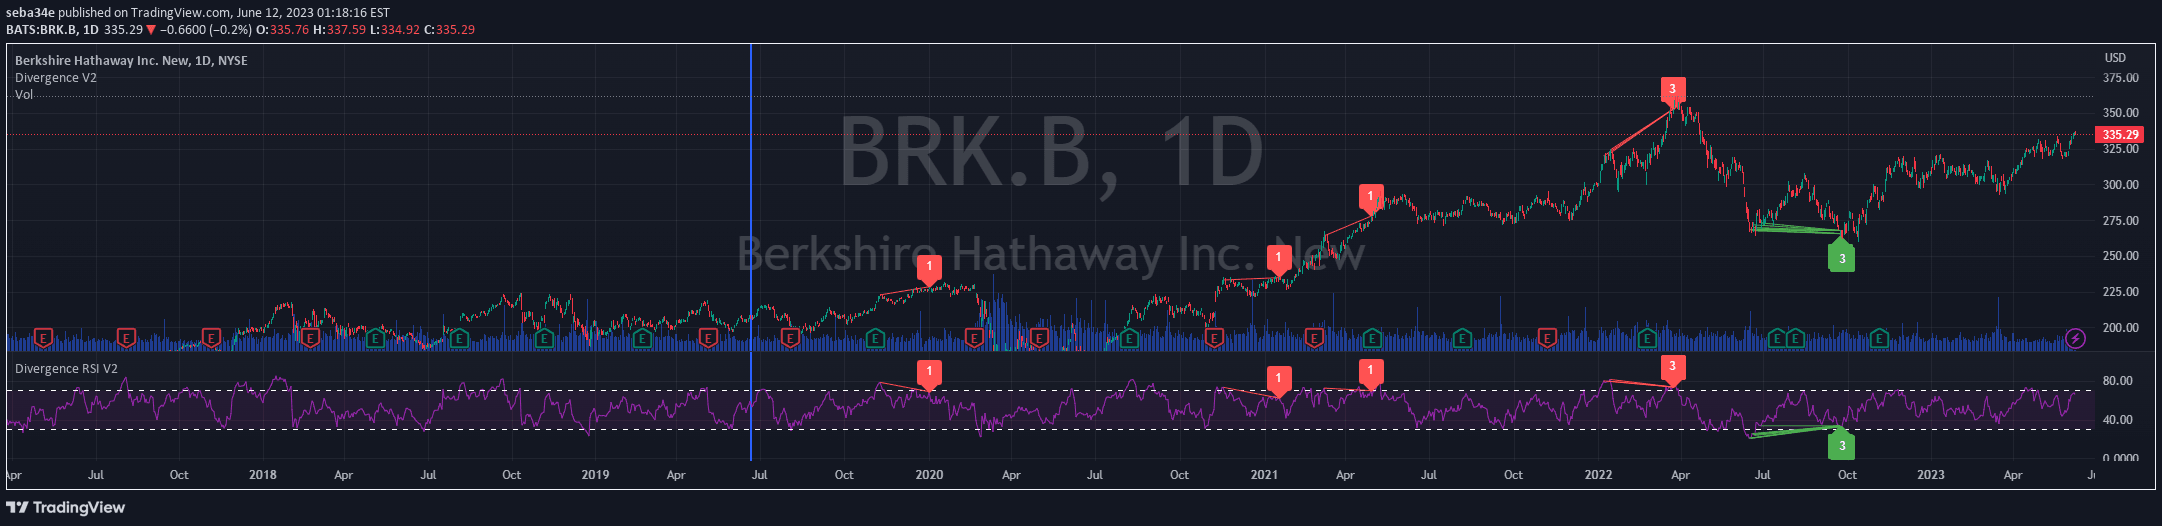
A dual RSI-based oscillator that combines fast and slow RSI lengths to generate trading signals through convergence, divergence, and moving average interactions.
Explore complementary indicator rolesHow it works
The indicator calculates two RSI lengths at different periods, creating a complex oscillator that tracks price momentum from multiple perspectives. It generates a signal line by averaging these RSI values and applies both Simple Moving Average (SMA) and Double Exponential Moving Average (DEMA) to the combined RSI data.
By comparing these moving averages and tracking their interactions, traders can identify potential trend shifts, momentum changes, and convergence or divergence signals. The indicator provides multiple layers of analysis through its moving average crossovers, zero-line interactions, and threshold-based measurements.
Why it may be useful
This advanced RSI-based oscillator offers traders a sophisticated tool for understanding market momentum and potential trend reversals. By combining multiple calculation methods and moving averages, it provides a more nuanced view of price action than traditional single-indicator approaches.
The flexibility of this indicator allows traders to customize their analysis, identifying complex signal combinations that can reveal hidden market dynamics. Its multi-layered approach helps traders make more informed decisions by providing a comprehensive view of price momentum and potential trend changes.
When to explore it
The indicator works best in markets with clear momentum trends and notable price fluctuations. Traders can effectively utilize this tool in volatile market conditions where rapid price changes and momentum shifts are common. It is particularly useful for identifying potential entry and exit points in different trading timeframes.
The versatility of this oscillator makes it suitable for various markets, including stocks, forex, cryptocurrencies, and commodities. Traders should combine this indicator with other technical analysis tools to confirm signals and reduce false positives, ensuring a more robust trading strategy.
Keep exploring
What we’ve verified
Access, alerts and repainting behaviour have not been independently verified for this indicator. Check the creator’s current publication and settings.
General descriptions and classifications are recovered research. Verified details above identify the specific checks we have completed. Check the creator’s current publication for later changes.