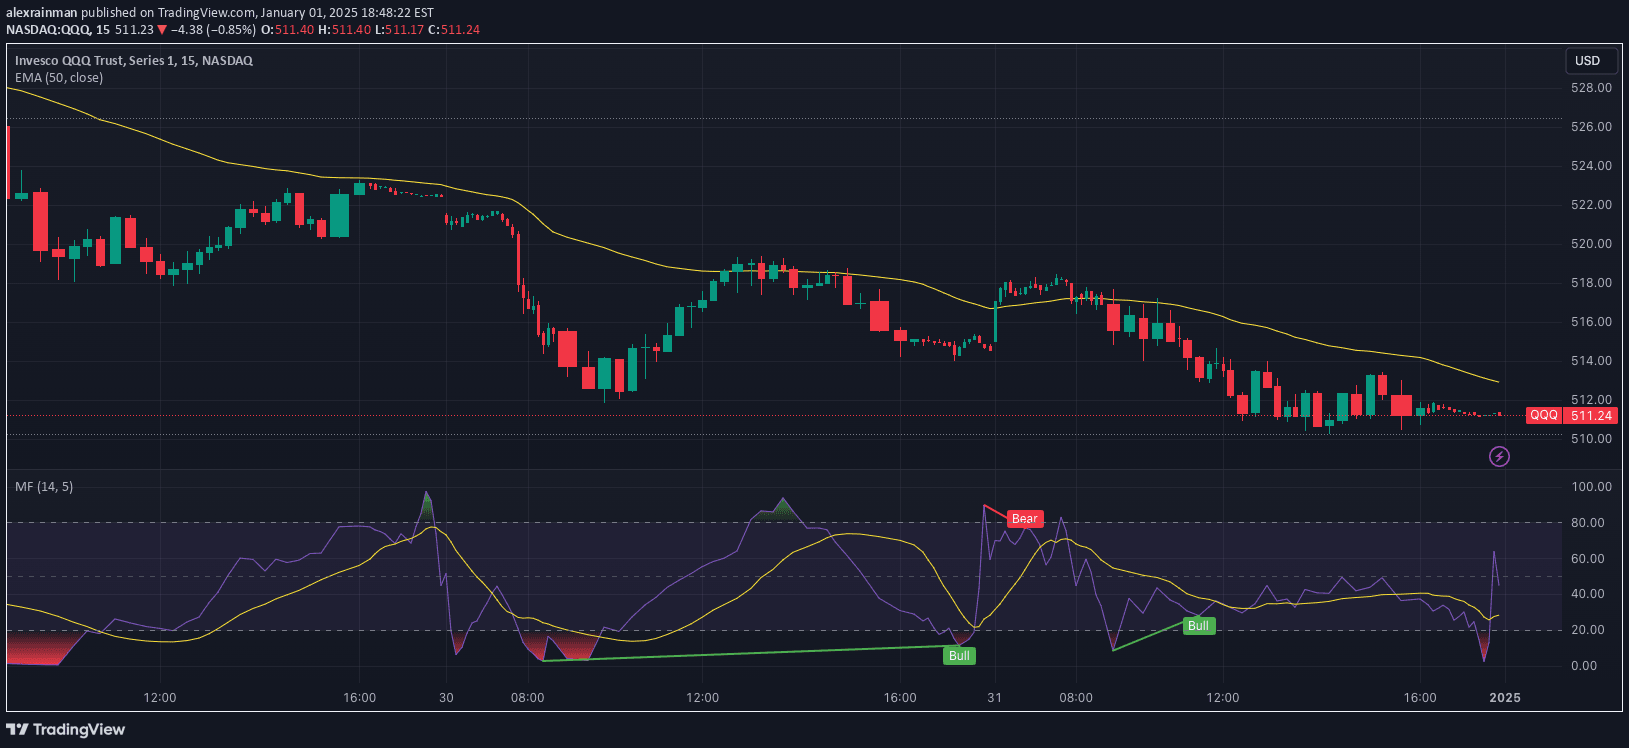
An advanced RSI toolkit expanding traditional momentum analysis through moving averages, divergences, and liquidity sweeps to enhance trading decision-making and trend identification.
Explore complementary indicator rolesHow it works
The RSI Toolkit operates by first calculating the standard Relative Strength Index and then applying advanced analytical techniques. It introduces a moving average overlay on the RSI to smooth out fluctuations and provide clearer trend signals, allowing traders to identify momentum shifts more effectively.
Additionally, the toolkit implements divergence and sweep detection mechanisms that analyze discrepancies between price action and RSI momentum. By tracking regular and hidden divergences, and identifying liquidity sweep points, the indicator helps traders recognize potential trend reversals and continuation patterns with greater precision.
Why it may be useful
The RSI Toolkit provides traders with a more nuanced understanding of market momentum beyond traditional RSI interpretation. By incorporating moving averages, it reduces noise and offers smoother trend insights, enabling more informed trading decisions across different market conditions.
The added features of divergence and sweep detection allow traders to anticipate potential trend changes and validate entry/exit points with greater confidence. These advanced techniques help traders align their strategies with underlying market dynamics, potentially improving trade timing and reducing false signal risks.
When to explore it
The RSI Toolkit is most effective in markets experiencing clear trend movements and moderate to high volatility. Traders can utilize this indicator when seeking to confirm trend strength, identify potential reversal points, and validate momentum shifts across various financial instruments and timeframes.
It becomes particularly valuable during periods of market transitions, such as when price is consolidating or showing early signs of trend change. Traders can leverage the toolkit's multiple features to cross-reference signals and make more comprehensive trading decisions, especially when combined with other technical analysis tools.
Keep exploring
What we’ve verified
Access, alerts and repainting behaviour have not been independently verified for this indicator. Check the creator’s current publication and settings.
General descriptions and classifications are recovered research. Verified details above identify the specific checks we have completed. Check the creator’s current publication for later changes.