
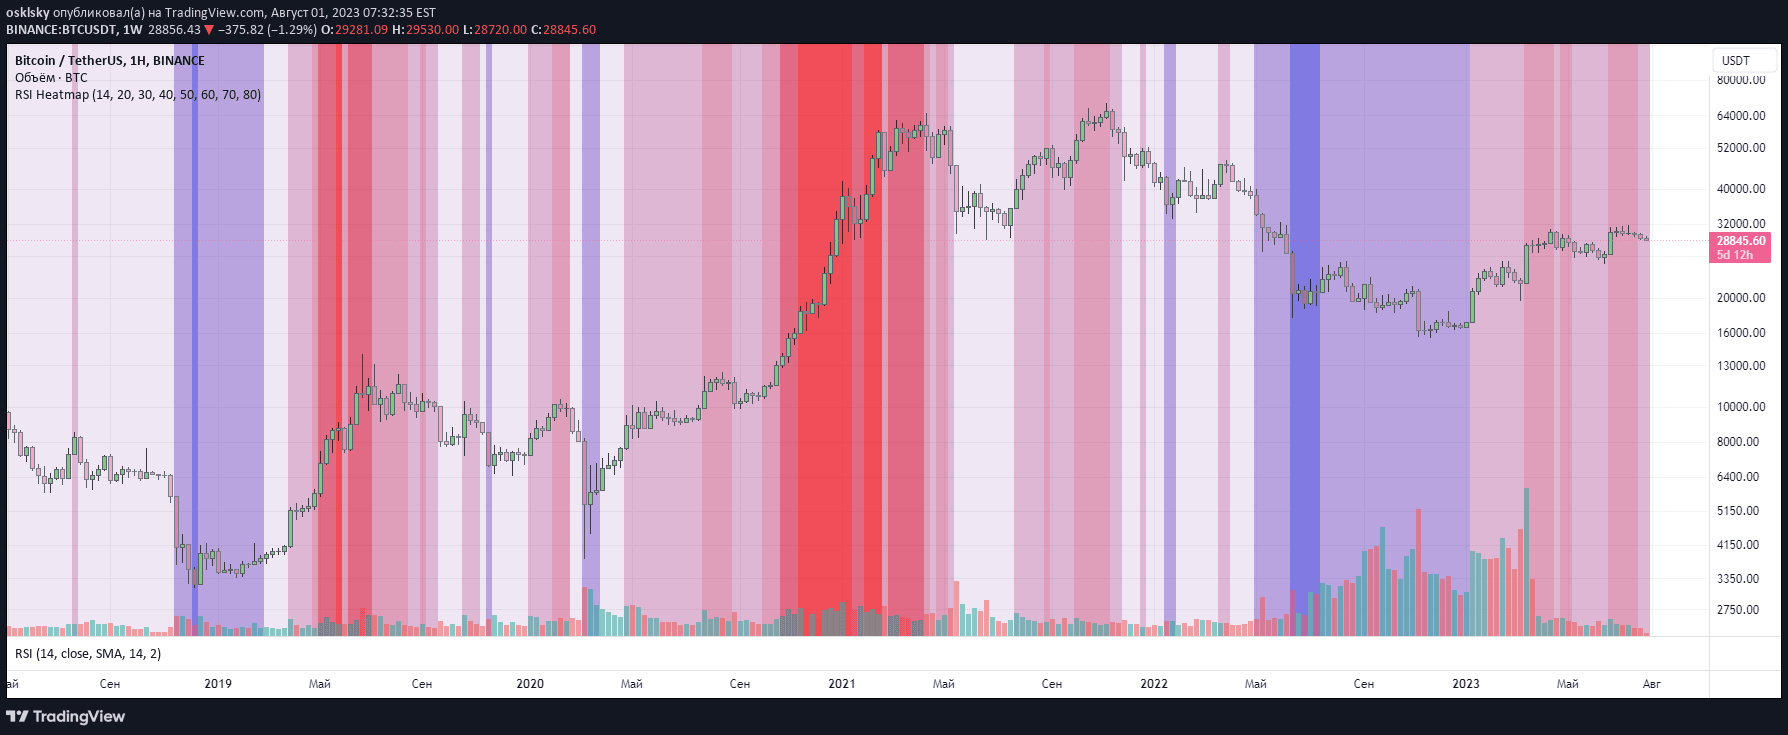
RSI Heatmap provides a visual representation of market conditions by highlighting oversold and overbought areas directly on the trading chart for quick market sentiment analysis.
Explore complementary indicator rolesHow it works
The RSI Heatmap works by using color-coded zones to represent the Relative Strength Index (RSI) values across different market conditions. When the RSI moves into specific ranges, the heatmap changes colors, with cooler tones indicating oversold regions and warmer tones signaling overbought territories.
These color transitions help traders quickly interpret market momentum and potential reversal points without complex calculations. The visual nature of the heatmap allows for rapid assessment of market sentiment, transforming numerical RSI data into an intuitive, easy-to-understand graphical representation.
Why it may be useful
The RSI Heatmap provides traders with an immediate, visually intuitive method to assess market momentum and potential trend reversals. By converting complex numerical data into color-coded zones, it enables faster decision-making and reduces the cognitive load of interpreting technical indicators.
This approach helps traders quickly identify potential entry and exit points, understand market sentiment, and make more informed trading decisions across different timeframes and market conditions. The heatmap's simplicity makes it accessible to both novice and experienced traders seeking quick market insights.
When to explore it
The RSI Heatmap is most effective in markets with clear trending or ranging conditions, where momentum indicators can provide reliable signals. It works exceptionally well in liquid markets like forex, stocks, and cryptocurrencies that exhibit consistent price movements and oscillations.
Traders should use the RSI Heatmap in conjunction with other technical analysis tools to confirm signals and reduce false positives. It is particularly useful during periods of market volatility, where quick visual assessments can help traders navigate rapidly changing market sentiments.
Keep exploring
What we’ve verified
Access, alerts and repainting behaviour have not been independently verified for this indicator. Check the creator’s current publication and settings.
General descriptions and classifications are recovered research. Verified details above identify the specific checks we have completed. Check the creator’s current publication for later changes.


