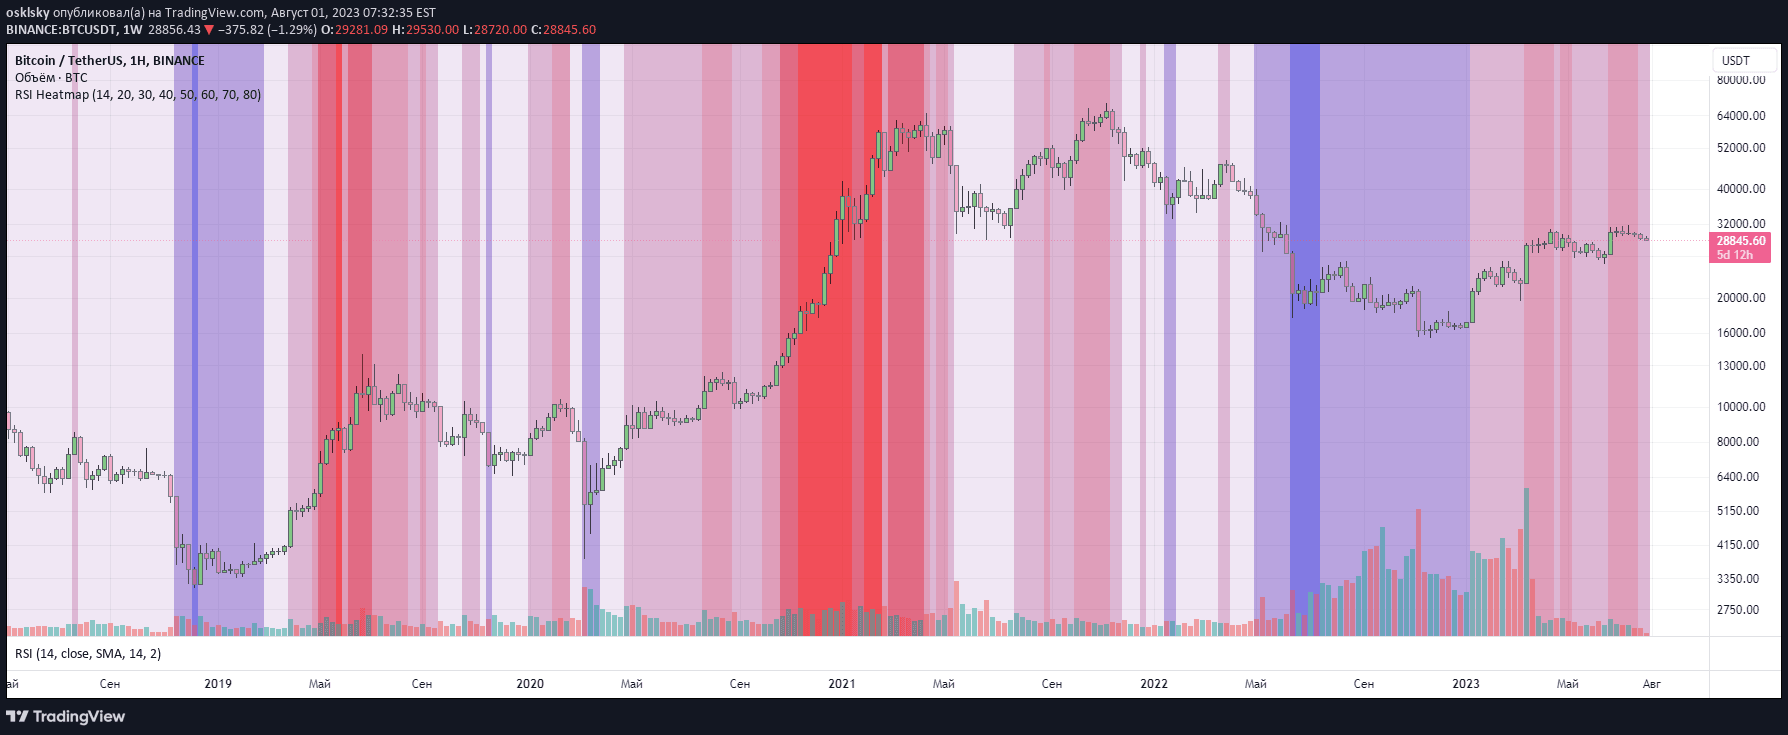
RSI Heart Indicator tracks market momentum across multiple timeframes using heart symbols, providing a visual representation of Relative Strength Index values from 10m to 1H.
Explore complementary indicator rolesHow it works
The RSI Heart Indicator calculates the Relative Strength Index across four different timeframes: 10m, 15m, 30m, and 1H. It uses a color-coded heart system to represent RSI values, with specific ranges triggering different emoji symbols that quickly communicate market conditions.
The indicator assigns heart emojis based on precise RSI thresholds: a red heart (❤️) appears when RSI is below 27 or above 73, indicating overbought or oversold conditions. A yellow heart (💛) signals proximity to extreme levels, while a green heart (💚) represents neutral market momentum between 30 and 70.
Why it may be useful
The RSI Heart Indicator simplifies complex momentum analysis by transforming numerical RSI data into intuitive visual representations. Traders can quickly assess market strength and potential trend reversals without diving deep into technical calculations, making it an accessible tool for both novice and experienced traders.
By providing multi-timeframe insights simultaneously, the indicator helps traders develop a more comprehensive understanding of market dynamics. The color-coded heart system allows for rapid sentiment assessment, enabling faster decision-making and potentially reducing emotional trading responses.
When to explore it
The RSI Heart Indicator is most effective during volatile market conditions where momentum shifts quickly and traders need rapid sentiment assessment. It works particularly well for assets with clear trending or oscillating price movements, helping traders identify potential entry and exit points across multiple timeframes.
Traders should use this indicator in conjunction with other technical analysis tools to confirm signals and validate potential trade opportunities. It is especially useful for short-term trading strategies like scalping and day trading, where quick market sentiment evaluation is crucial for making timely trading decisions.
Keep exploring
What we’ve verified
Access, alerts and repainting behaviour have not been independently verified for this indicator. Check the creator’s current publication and settings.
General descriptions and classifications are recovered research. Verified details above identify the specific checks we have completed. Check the creator’s current publication for later changes.