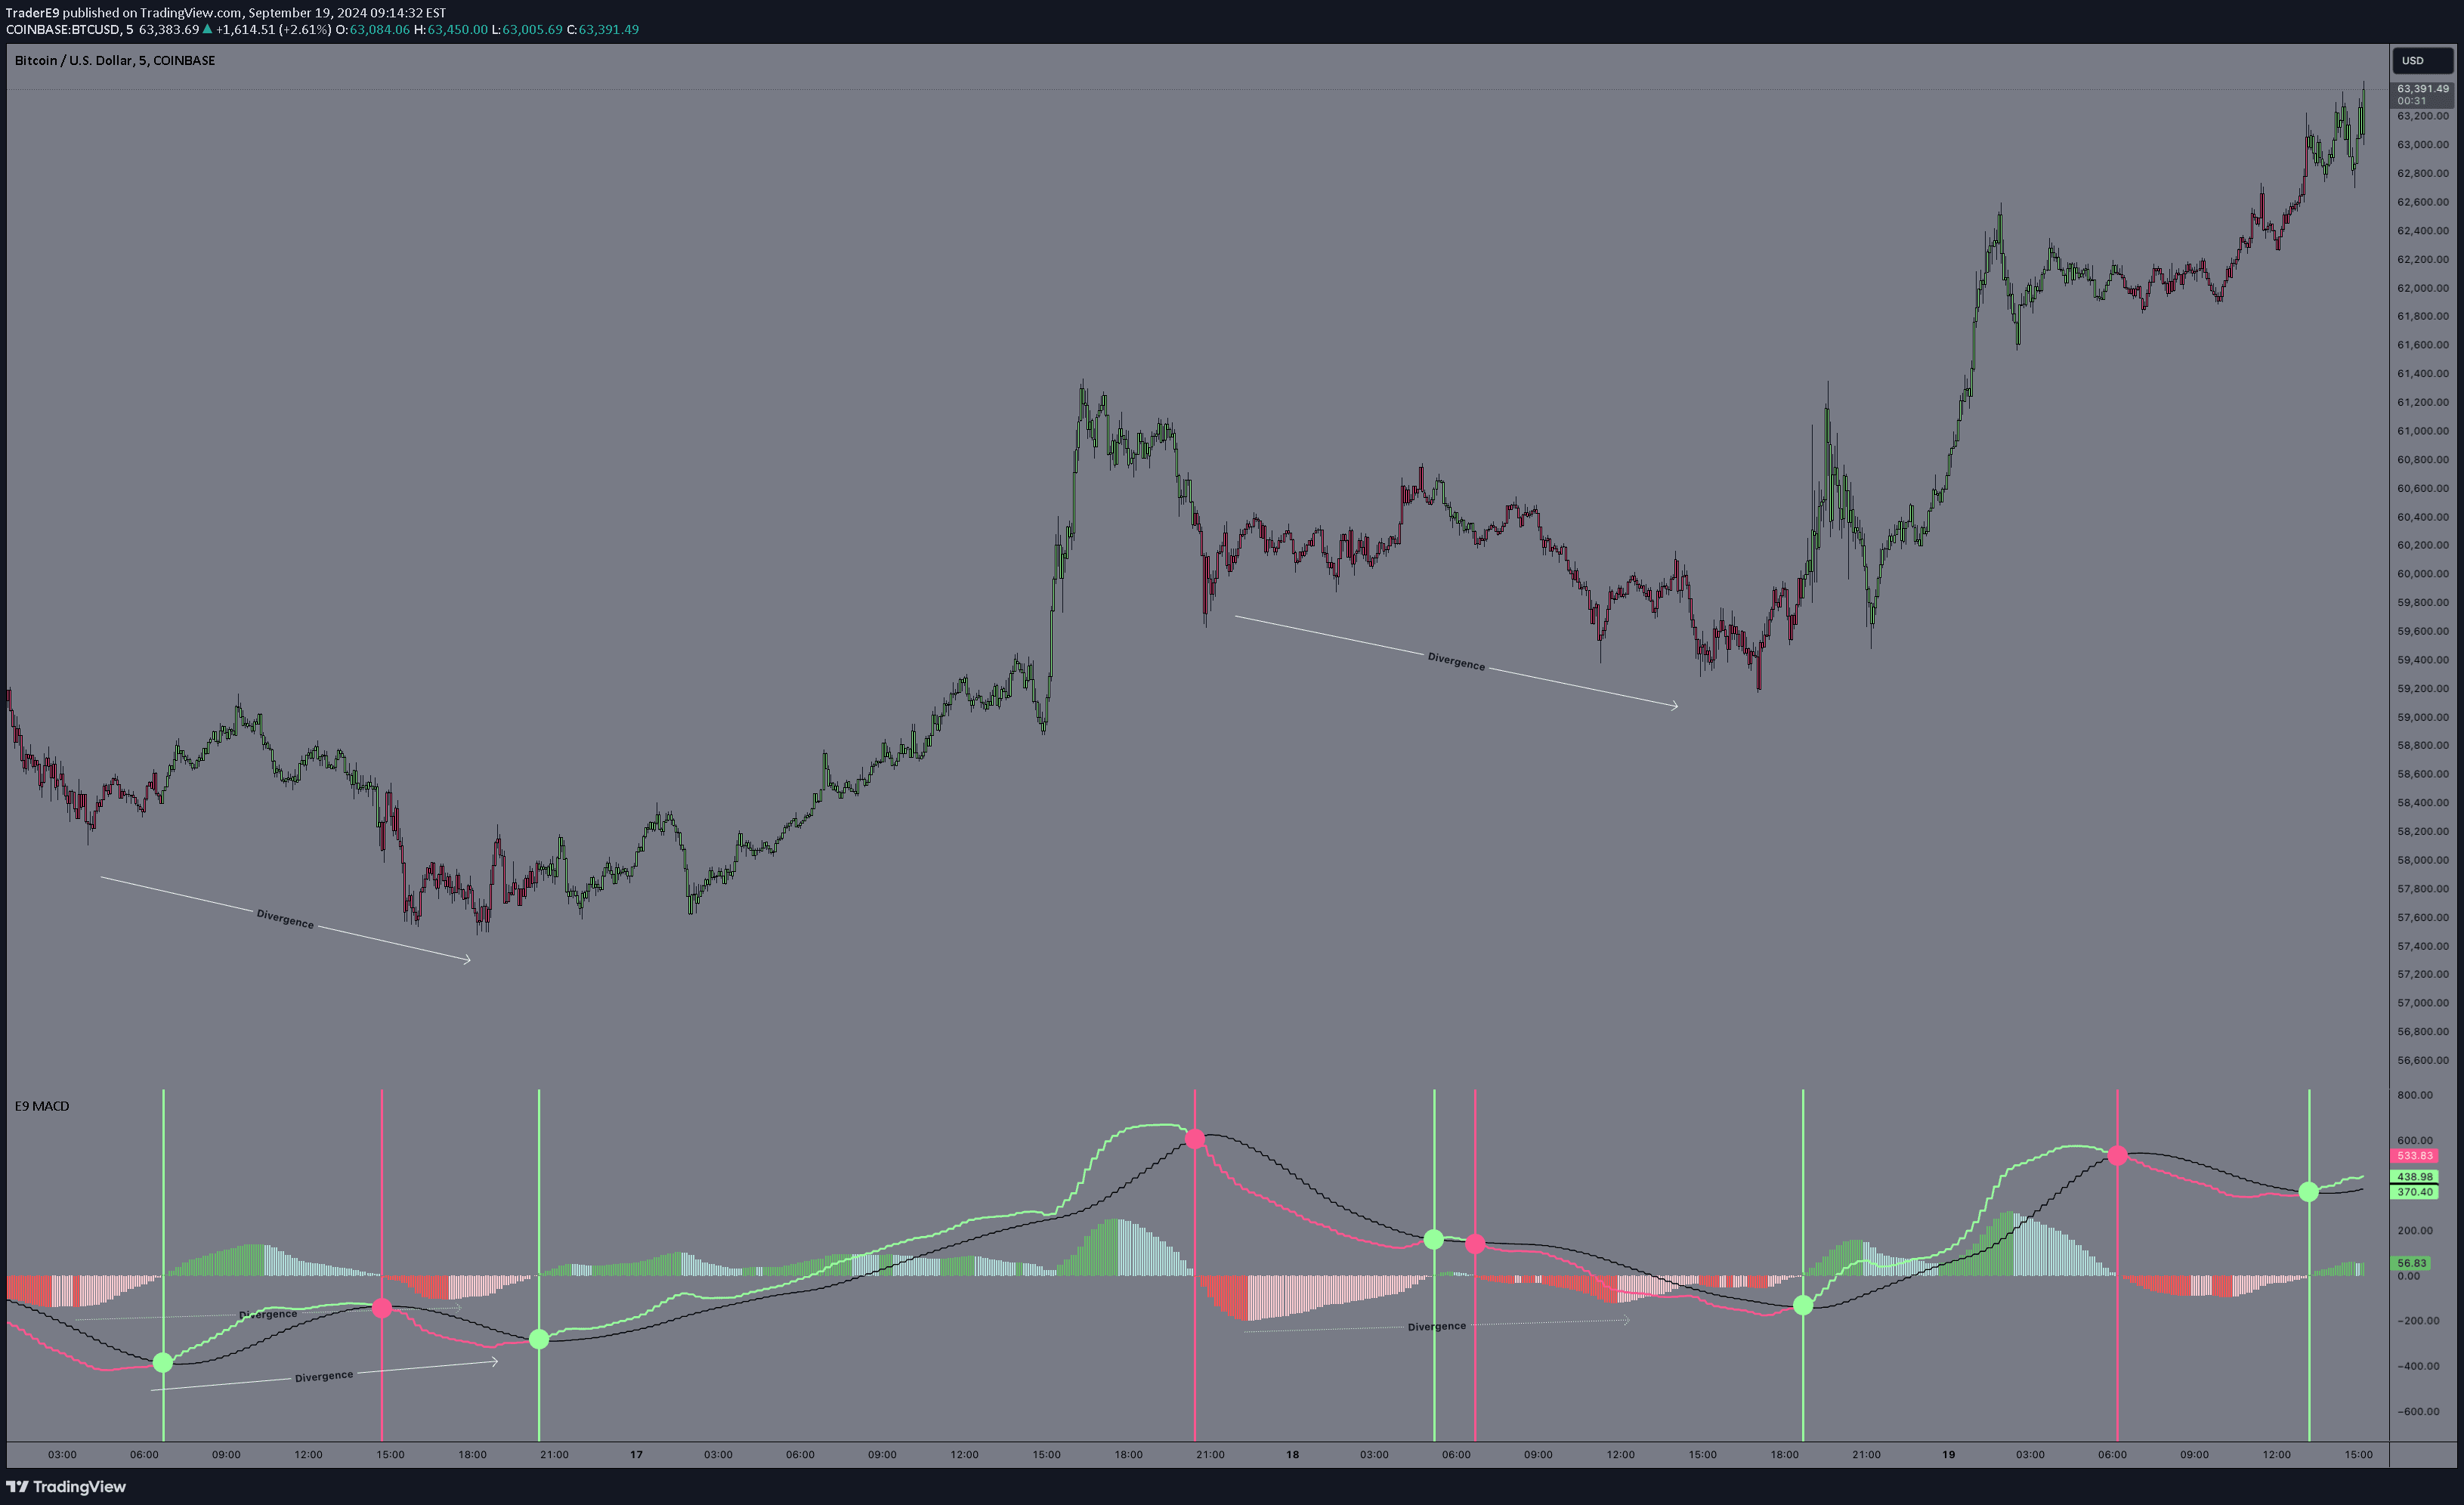
A unique trading signal that uses RSI as the source for MACD calculation, providing a smoothed perspective on market trends and potential crossover confirmations.
Explore complementary indicator rolesHow it works
This signal generates a MACD indicator by using the Relative Strength Index (RSI) as its source data instead of traditional price information. By calculating the MACD lines and histogram using RSI values, the indicator creates a unique perspective on market momentum and trend changes.
The process involves applying standard MACD calculation methods to RSI data, which means computing the difference between two exponential moving averages of the RSI. This approach smooths out the RSI's movements and provides a more nuanced view of price momentum, potentially offering earlier or more refined signals compared to conventional MACD calculations.
Why it may be useful
By integrating RSI characteristics into the MACD calculation, traders gain a more comprehensive view of market dynamics that combines momentum measurement with trend identification. This hybrid approach can potentially reduce market noise and provide more reliable signals by leveraging the strengths of both indicators.
The unique methodology allows traders to potentially identify trend changes and momentum shifts with greater precision, as the RSI-based MACD can offer smoother, more filtered signals. This can be especially valuable in volatile or choppy market conditions where traditional indicators might generate less reliable information.
When to explore it
This signal is most effective in markets with clear momentum trends and when traders want to combine multiple technical analysis perspectives. It works particularly well in liquid markets with sufficient price movement, such as major forex pairs, large-cap stocks, and actively traded commodities.
Traders should consider using this signal during periods of moderate to high market volatility, where traditional indicators might struggle to provide clear signals. It is especially useful when confirming potential trend reversals, identifying potential entry and exit points, and understanding the underlying momentum of a financial instrument.
Keep exploring
What we’ve verified
Access, alerts and repainting behaviour have not been independently verified for this indicator. Check the creator’s current publication and settings.
General descriptions and classifications are recovered research. Verified details above identify the specific checks we have completed. Check the creator’s current publication for later changes.