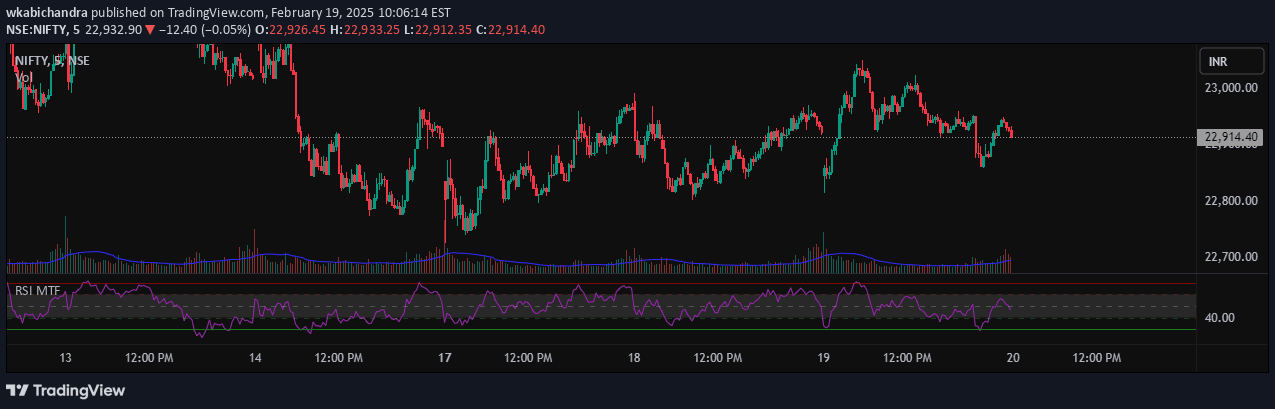
A multi-timeframe RSI indicator that analyzes market momentum across three different intervals, providing comprehensive insights into potential trend reversals and market conditions.
Explore complementary indicator rolesHow it works
The RSI Multiple TimeFrame script calculates Relative Strength Index (RSI) values across three different timeframes simultaneously, using a standard RSI calculation with customizable period and price source. It plots these RSI values with distinct colors and line widths, allowing traders to visually compare momentum across short, medium, and long-term intervals.
The script generates visual signals through green and red dots that indicate potential buying or selling opportunities. These signals are triggered when specific RSI conditions are met across multiple timeframes, such as RSI values falling within predefined oversold or overbought ranges and showing directional momentum changes.
Why it may be useful
Multi-timeframe RSI analysis provides traders with a more comprehensive view of market momentum, reducing the risk of making decisions based on limited perspective. By examining RSI across different intervals, traders can confirm trends, identify potential reversals, and align their trading strategies with broader market dynamics.
The indicator's unique signaling mechanism helps traders pinpoint high-probability turning points by ensuring momentum is consistently aligned across multiple timeframes. This approach offers a more nuanced and robust method of interpreting market conditions compared to traditional single-timeframe RSI indicators.
When to explore it
The RSI Multiple TimeFrame indicator is most effective in markets with clear trending or oscillating characteristics, where momentum plays a significant role in price movement. It works particularly well in liquid markets like forex, stocks, and cryptocurrencies, where price trends can be identified across multiple timeframes.
Traders should use this indicator when seeking to confirm trend strength, identify potential entry and exit points, and gain a more holistic understanding of market momentum. It is especially useful during periods of market transition, where early identification of trend reversal can provide a competitive advantage.
Keep exploring
What we’ve verified
Access, alerts and repainting behaviour have not been independently verified for this indicator. Check the creator’s current publication and settings.
General descriptions and classifications are recovered research. Verified details above identify the specific checks we have completed. Check the creator’s current publication for later changes.