
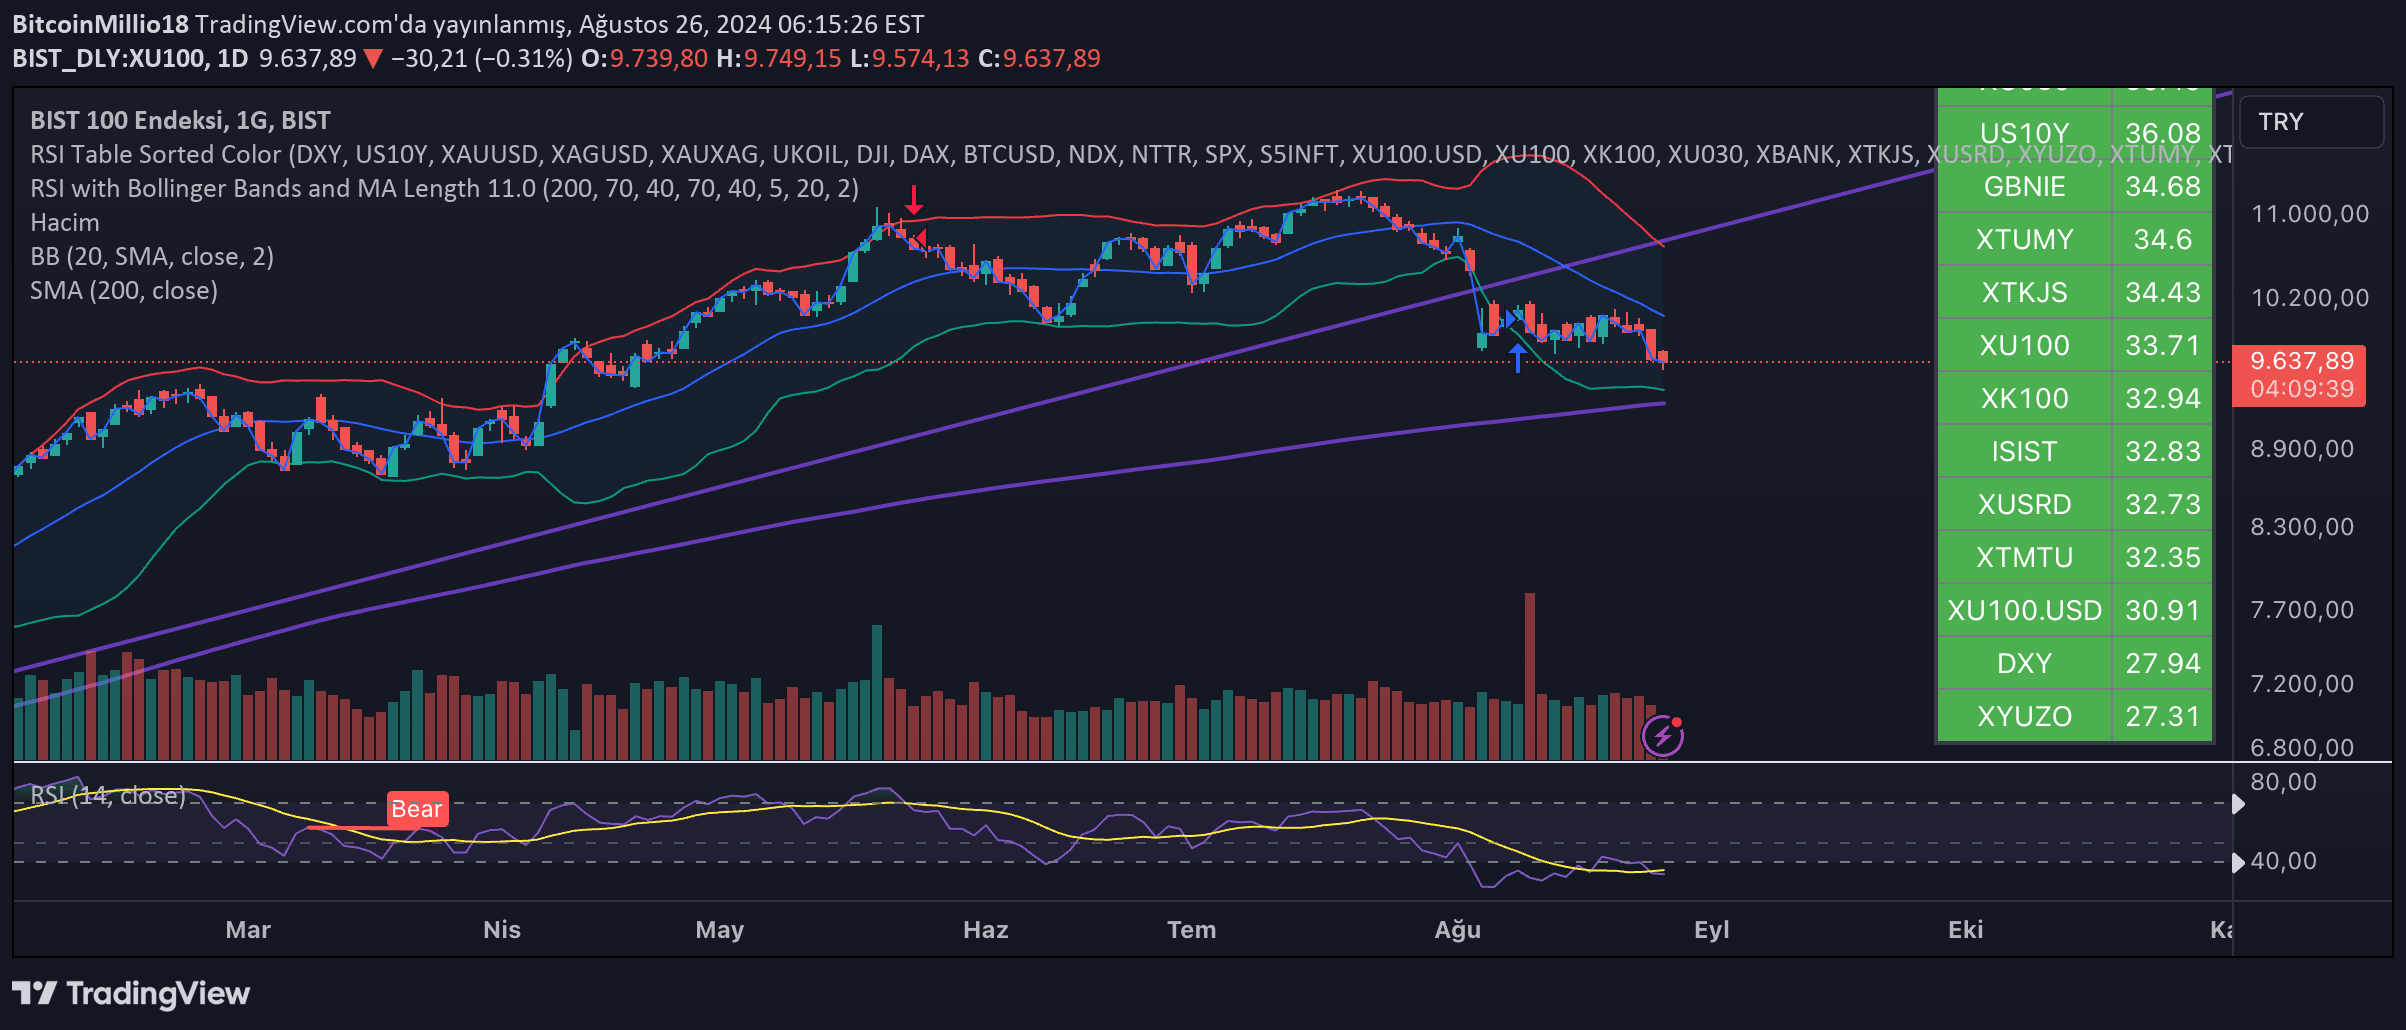
RSI Overlay Table tracks Relative Strength Index across multiple tickers, providing real-time overbought and oversold conditions for up to 30 assets simultaneously.
Explore complementary indicator rolesHow it works
The RSI Overlay Table script calculates the Relative Strength Index for multiple tickers using a customizable length, typically defaulting to 14 periods. It automatically computes RSI values for each selected ticker, comparing them against user-defined overbought and oversold thresholds.
The script then generates a color-coded table displaying these RSI values, with red highlighting overbought conditions and green indicating oversold conditions. Traders can choose to hide neutral rows, focusing only on assets showing extreme RSI readings that might signal potential price reversals.
Why it may be useful
The RSI Overlay Table provides traders with a comprehensive view of market conditions across multiple assets simultaneously, enabling more efficient and informed decision-making. By presenting RSI values in a clear, color-coded format, the script helps traders quickly identify potential trading opportunities without manually calculating or switching between different charts.
This tool is particularly valuable for traders managing diverse portfolios, as it streamlines technical analysis and allows rapid assessment of relative strength across various securities. The customizable settings ensure the script can be adapted to different trading styles and strategies, making it a versatile analytical tool.
When to explore it
The RSI Overlay Table is most effective when traders are monitoring multiple assets and want to quickly identify potential momentum shifts or overbought/oversold conditions. It works particularly well in markets with significant price movements and when traders are looking to capture short to medium-term trading opportunities.
The script is especially useful for swing traders, portfolio managers, and active traders who need to track technical indicators across numerous securities efficiently. By providing a rapid overview of RSI conditions, it helps traders focus their attention on the most promising assets and potential trading setups.
Keep exploring
What we’ve verified
Access, alerts and repainting behaviour have not been independently verified for this indicator. Check the creator’s current publication and settings.
General descriptions and classifications are recovered research. Verified details above identify the specific checks we have completed. Check the creator’s current publication for later changes.


