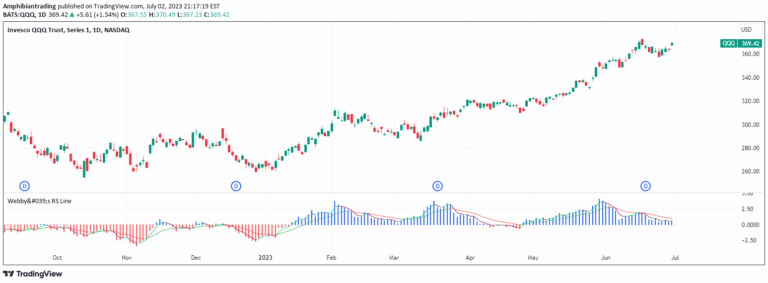
MGO Primary is an advanced trading methodology that transforms market movement into a predictable sequence using blockchain-inspired graphical analysis and mathematical price interpretation.
Explore complementary indicator rolesHow it works
The MGO Primary indicator operates by analyzing price blocks, cycles, and frequency through a mathematical lens, replacing traditional candlestick emotional reading with objective sequencing. It detects specific oscillatory phenomena like bullish and bearish pivots and breakouts, mapping market order behavior with precision.
By leveraging blockchain-like architectural principles, the indicator breaks down price movements into logical rhythmic patterns, identifying critical entry and exit zones across different timeframes. It uses primary and secondary RSI to validate the strength behind market movements, transforming subjective trading interpretations into statistically-driven insights.
Why it may be useful
The MGO Primary offers traders a systematic approach to market analysis by eliminating emotional bias and introducing mathematical rigor to trading decisions. Its blockchain-inspired methodology provides a structured framework for understanding market dynamics, allowing traders to move beyond traditional candlestick interpretation.
By revealing underlying order book behaviors and highlighting precise entry and exit points, this indicator empowers traders to make more informed and disciplined trading choices. Its ability to detect rhythmic patterns and validate movement strength makes it a powerful tool for those seeking a more objective and statistically-grounded trading strategy.
When to explore it
The MGO Primary is most effective on 12-hour and 4-hour timeframes, particularly for trading indices like NASDAQ, liquid stocks, and futures contracts. Its high precision makes it especially valuable for traders seeking statistical clarity and visual logic in their market analysis.
Traders should combine this indicator with robust risk management strategies and comprehensive macro context analysis to maximize its potential. It is particularly suited for operators looking to escape the subjectivity of traditional candlestick reading and implement a more structured, mathematically-driven approach to market interpretation.
Keep exploring
What we’ve verified
Access, alerts and repainting behaviour have not been independently verified for this indicator. Check the creator’s current publication and settings.
General descriptions and classifications are recovered research. Verified details above identify the specific checks we have completed. Check the creator’s current publication for later changes.