
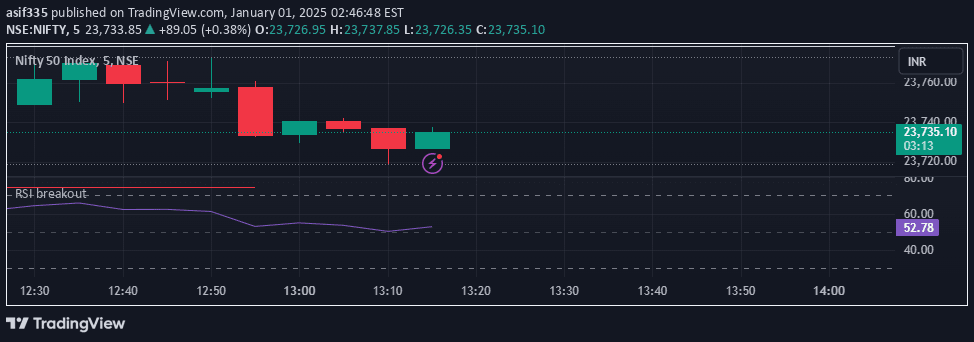
A custom RSI indicator that identifies potential breakout points using Relative Strength Index and Williams Fractals to highlight key momentum shifts in market trends.
Explore complementary indicator rolesHow it works
The RSI Breakout Asif indicator calculates the Relative Strength Index using a user-defined length and price source, creating horizontal reference lines at 30, 50, and 70 levels to indicate market conditions. It simultaneously applies Williams Fractals to the RSI values, detecting and highlighting potential breakout points through dynamic symmetrical lines that mark fractal highs in red and fractal lows in green.
Traders can customize the indicator's settings, including RSI length, price source, and fractal parameters, allowing for personalized analysis across different trading styles and market environments. The tool provides visual cues that help traders identify momentum shifts and potential trend reversals by analyzing the RSI's movement and fractal breakout signals.
Why it may be useful
The RSI Breakout Asif indicator offers traders a sophisticated method to assess market momentum and potential trend changes through a comprehensive visual analysis tool. By combining RSI calculations with Williams Fractals, the indicator provides a multi-dimensional view of market dynamics that goes beyond traditional single-indicator approaches.
This approach helps traders make more informed decisions by offering clear, customizable signals that highlight potential entry and exit points. The indicator's ability to adapt to different trading styles and market conditions makes it a versatile tool for traders seeking to enhance their technical analysis and improve their understanding of market momentum.
When to explore it
The RSI Breakout Asif indicator is most effective in markets with clear trending or ranging conditions, where momentum shifts can be readily identified through RSI and fractal analysis. It works particularly well in liquid markets with consistent price movements, such as major forex pairs, stock indices, and actively traded commodities.
Traders should use this indicator in conjunction with other technical analysis tools to confirm signals and reduce false positives. It is especially useful during periods of market volatility, when rapid momentum changes can present significant trading opportunities across various timeframes and asset classes.
Keep exploring
What we’ve verified
Access, alerts and repainting behaviour have not been independently verified for this indicator. Check the creator’s current publication and settings.
General descriptions and classifications are recovered research. Verified details above identify the specific checks we have completed. Check the creator’s current publication for later changes.


