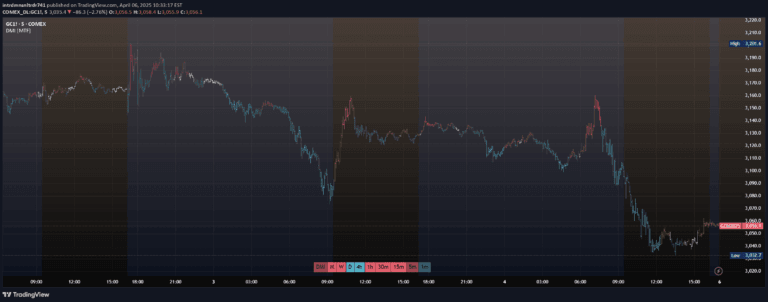
An RSI-based trading signal that uses color-coded zones to identify potential bullish and bearish market conditions, helping traders spot entry and exit points through momentum analysis.
Explore complementary indicator rolesHow it works
The RV - RSI B/S V1.2 indicator operates by analyzing the Relative Strength Index (RSI) and interpreting its values through color-coded zones. By tracking the RSI's movement between 10 and 90, the indicator provides visual signals about market momentum and potential trading opportunities.
The indicator uses specific color codes to represent different market conditions: green for bullish zones (60-80), red for overbought areas (>80), orange for bearish zones (20-40), and pink for oversold conditions (<20). These color-coded zones help traders quickly identify potential entry and exit points based on the RSI's current value and momentum.
Why it may be useful
The RV - RSI B/S V1.2 indicator is crucial for traders seeking to understand market momentum and identify potential trading opportunities with greater precision. By color-coding RSI zones, the indicator transforms complex numerical data into an easily digestible visual format, allowing traders to make more informed decisions.
Moreover, the indicator helps traders avoid false trades by clearly demarcating overbought and oversold conditions. By providing a multi-faceted approach that includes moving averages and Bollinger Bands, the signal offers a comprehensive tool for analyzing market trends and momentum.
When to explore it
The RV - RSI B/S V1.2 indicator is most effective in markets with clear trending or ranging characteristics, where momentum signals can provide reliable insights. It performs particularly well in short to medium-term trading scenarios, especially for traders who prefer systematic, rule-based entry and exit strategies.
Traders should use this indicator alongside other technical analysis tools to confirm signals and validate potential trades. It is especially useful in markets with moderate volatility, where RSI can provide meaningful insights into potential trend reversals and momentum shifts.
Keep exploring
What we’ve verified
Access, alerts and repainting behaviour have not been independently verified for this indicator. Check the creator’s current publication and settings.
General descriptions and classifications are recovered research. Verified details above identify the specific checks we have completed. Check the creator’s current publication for later changes.