
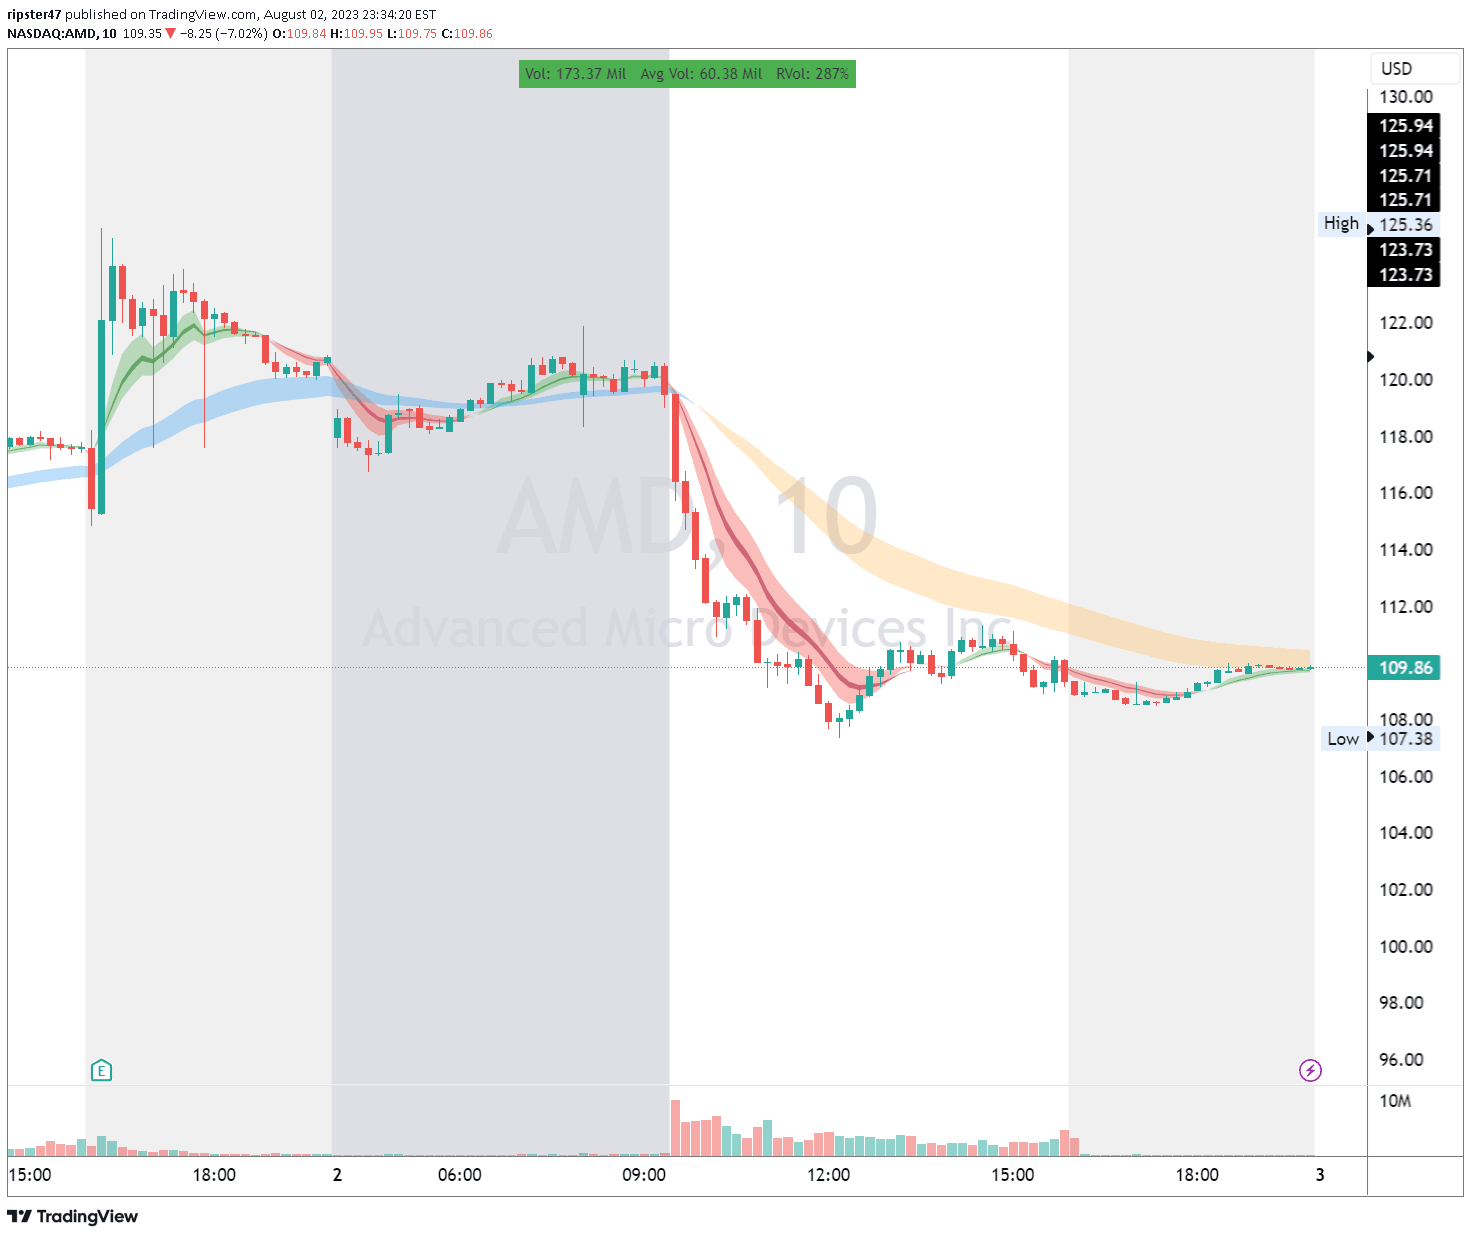
Relative Volume indicator measures trading volume compared to historical averages, helping traders identify significant market activity and potential trading opportunities across different timeframes.
Explore complementary indicator rolesHow it works
Relative Volume (RVol) calculates the current trading volume in comparison to historical volume averages for specific timeframes like daily, weekly, or monthly charts. It dynamically adjusts its calculation based on the selected chart resolution, providing a normalized view of trading volume that helps traders understand market participation and potential price movements.
The indicator compares current volume against past volume data, generating a percentage or ratio that indicates whether trading activity is higher or lower than typical historical levels. It can display today's volume, total average volume, and provide visual representations of volume compared to standard market activity.
Why it may be useful
Relative Volume is crucial for traders because it provides insights into market momentum, interest, and potential price trends that pure price action might not reveal. By understanding volume dynamics, traders can identify potentially significant market movements, confirm trend strength, and avoid low-participation trading scenarios.
The indicator helps traders make more informed decisions by revealing underlying market sentiment and participation levels. It acts as a powerful confirmatory tool that can highlight potential breakouts, trend reversals, and critical market turning points before they become apparent through price movement alone.
When to explore it
Relative Volume works best during active market sessions, particularly during the first 15-30 minutes of trading when volume tends to be most revealing about potential daily market direction. It is especially useful around key market events, earnings releases, and significant news that might trigger unusual trading activity.
Traders should leverage Relative Volume when seeking confirmation of trend strength, evaluating potential breakouts, or determining whether a price movement has meaningful market backing. It is most effective when combined with other technical analysis tools and used as part of a comprehensive trading strategy that includes risk management principles.
Keep exploring
What we’ve verified
Access, alerts and repainting behaviour have not been independently verified for this indicator. Check the creator’s current publication and settings.
General descriptions and classifications are recovered research. Verified details above identify the specific checks we have completed. Check the creator’s current publication for later changes.





