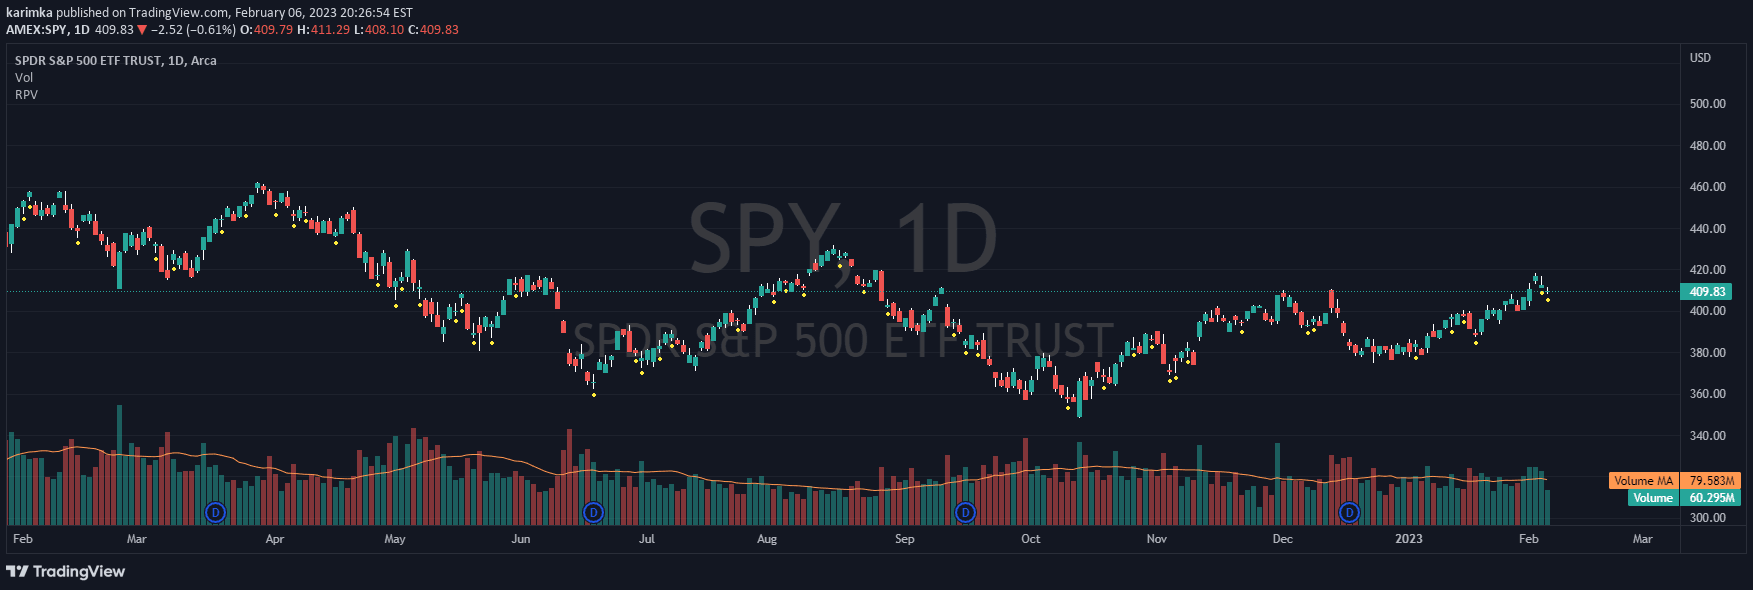
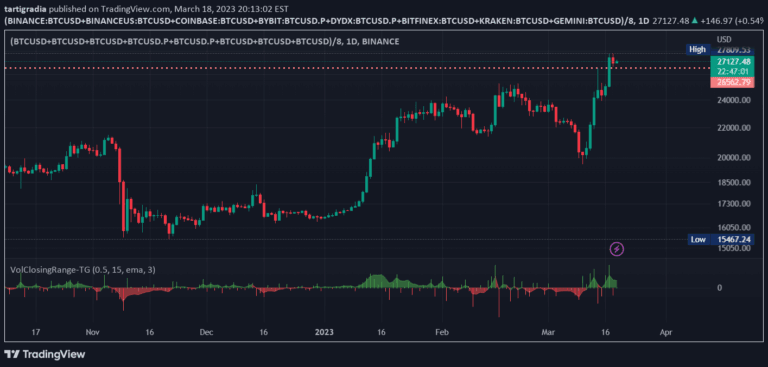
RVOL++ is an intraday trading indicator that measures market participation by comparing current trading volume to historical average volume, helping traders understand market pace and potential opportunities.
Explore complementary indicator rolesHow it works
RVOL++ calculates relative volume by comparing the current cumulative trading volume to the average volume from a specified lookback period. Traders first define their trading session times and choose between two modes: Two Session (for 23+ hour markets) or Daily Mode (for standard stock trading).
The calculation involves measuring the current period's volume and dividing it by the average volume from previous days, then multiplying by 100 to get a percentage. This percentage is then color-coded into three ranges: low (40-80), neutral (80-120), and high (120+) to provide visual insights into market participation.
Why it may be useful
RVOL++ is crucial for traders because it provides a real-time snapshot of market participation and potential momentum. By understanding volume relative to historical averages, traders can make more informed decisions about market conditions, potential price movements, and trading strategy adjustments.
The indicator helps traders avoid low-participation periods and identify high-energy trading windows. Its color-coded visualization makes it easy to quickly interpret market dynamics, reducing emotional decision-making and providing a systematic approach to understanding market rhythm and potential trading opportunities.
When to explore it
RVOL++ is most effective for intraday traders focused on short-term market movements, particularly in highly liquid markets like stocks, futures, forex, and cryptocurrencies. It works best during regular trading hours when volume data is most reliable and representative of market sentiment.
Traders should pay special attention to the indicator during market open, after economic news releases, and during periods of potential high volatility. The tool is particularly useful for day traders and scalpers who need to quickly assess market participation and potential price momentum before entering or exiting trades.
Keep exploring
What we’ve verified
Access, alerts and repainting behaviour have not been independently verified for this indicator. Check the creator’s current publication and settings.
General descriptions and classifications are recovered research. Verified details above identify the specific checks we have completed. Check the creator’s current publication for later changes.