YOUR INDICATOR RESEARCH STARTS HERE

Find the right indicator.
Understand what it does.

Explore 11,183 indicators. Filter beyond the obvious.
Discover the tools that fit the way you trade.

THE INDICATOR LIBRARY

Results for “rvol”

11,183 tools to explore

81 indicators matching your filters
Save search
VolumeTrendEditor’s pick

#NAME?

by ClassicScott

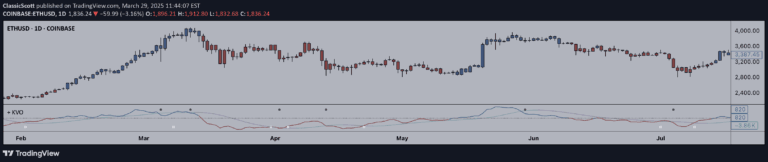
The Klinger Oscillator is a volume-based technical indicator that compares price changes and volume to determine potential trend reversals and market momentum.

Separate pane · unverifiedDay Trading · Swing Trading
Explore
1.9Klikes62.3Kviews40comments
Save
VolumeSignal

RVol Label

by ripster47

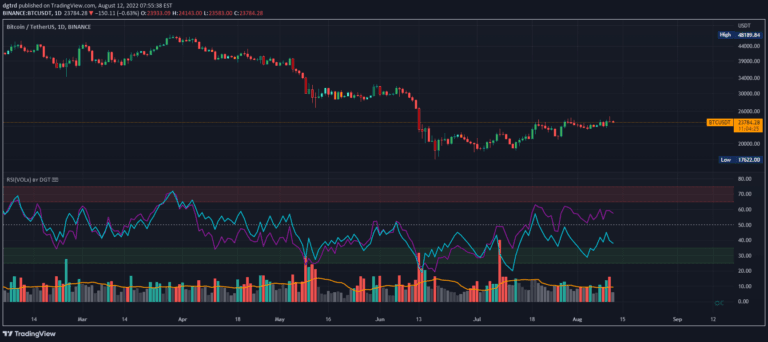
Relative Volume indicator measures trading volume compared to historical averages, helping traders identify significant market activity and potential trading opportunities across different timeframes.

Separate pane · unverifiedScalping · Day Trading
Explore
1.3Klikes15.7Kviews7comments
Save
MomentumOscillatorSignal

LiquidFusion SignalPro [CHE]

by chervolino

A comprehensive trading indicator combining seven sub-indicators to generate high-quality trade entries and exits across different market conditions, providing multi-layered market analysis.

Separate pane · unverifiedScalping · Day Trading
Explore
810likes13Kviews19comments
Save
MomentumSignalTrend

Bulls And Bears [CHE]

by chervolino

Bulls And Bears [CHE] is a trading indicator that identifies potential market entry points by analyzing maximum and minimum values, RSI momentum, and calculating super smooth moving averages.

Main price chart · unverifiedScalping · Day Trading
Explore
693likes6.5Kviews4comments
Save
SignalLevels

DR IDR Trading Areas [CHE]

by chervolino

A custom trading indicator that identifies average price movements across different trading periods, using time-based averages to create dynamic support and resistance lines.

Main price chart · unverifiedScalping · Day Trading
Explore
498likes13.1Kviews13comments
Save
MomentumOscillatorSignal

DOTS [CHE]

by chervolino

A practical trading indicator that identifies overbought and oversold market conditions, helping traders make informed entry and exit decisions across various timeframes.

Separate pane · unverifiedScalping · Day Trading
Explore
427likes11.4Kviews12comments
Save

Likes, views, and comments are historical TradingView snapshots. They describe attention, not trading performance.

START WITH A QUESTION

A little less searching.
A lot more understanding.

Tell DeepAlpha what you need. Get an explanation, a shortlist,
and a direct path to the indicators behind it.

Ask DeepAlpha