
#NAME?
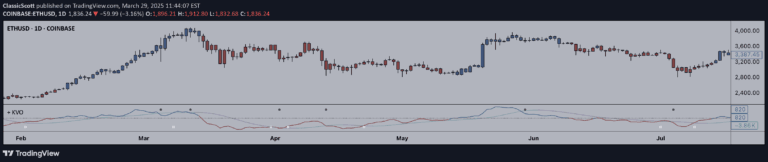
The Klinger Oscillator is a volume-based technical indicator that compares price changes and volume to determine potential trend reversals and market momentum.
Explore 11,183 indicators. Filter beyond the obvious.
Discover the tools that fit the way you trade.
11,183 tools to explore
The Klinger Oscillator is a volume-based technical indicator that compares price changes and volume to determine potential trend reversals and market momentum.
A stochastic oscillator indicator that identifies support and resistance zones by tracking when price exits overbought or oversold levels, with optional candle coloring and signal plotting.
ACBR is a volatility and momentum indicator that measures candle body expansion to highlight periods of increasing market volatility and potential trading opportunities.
Bollinger Bands Width indicator that measures market volatility by tracking the distance between upper and lower bands, enhanced with a signal line and baseline for more comprehensive analysis.
Likes, views, and comments are historical TradingView snapshots. They describe attention, not trading performance.