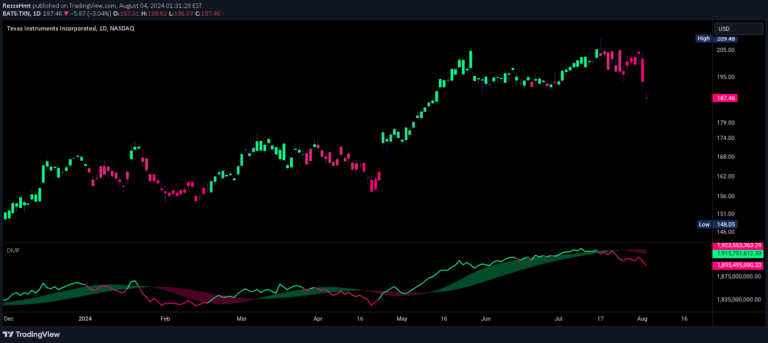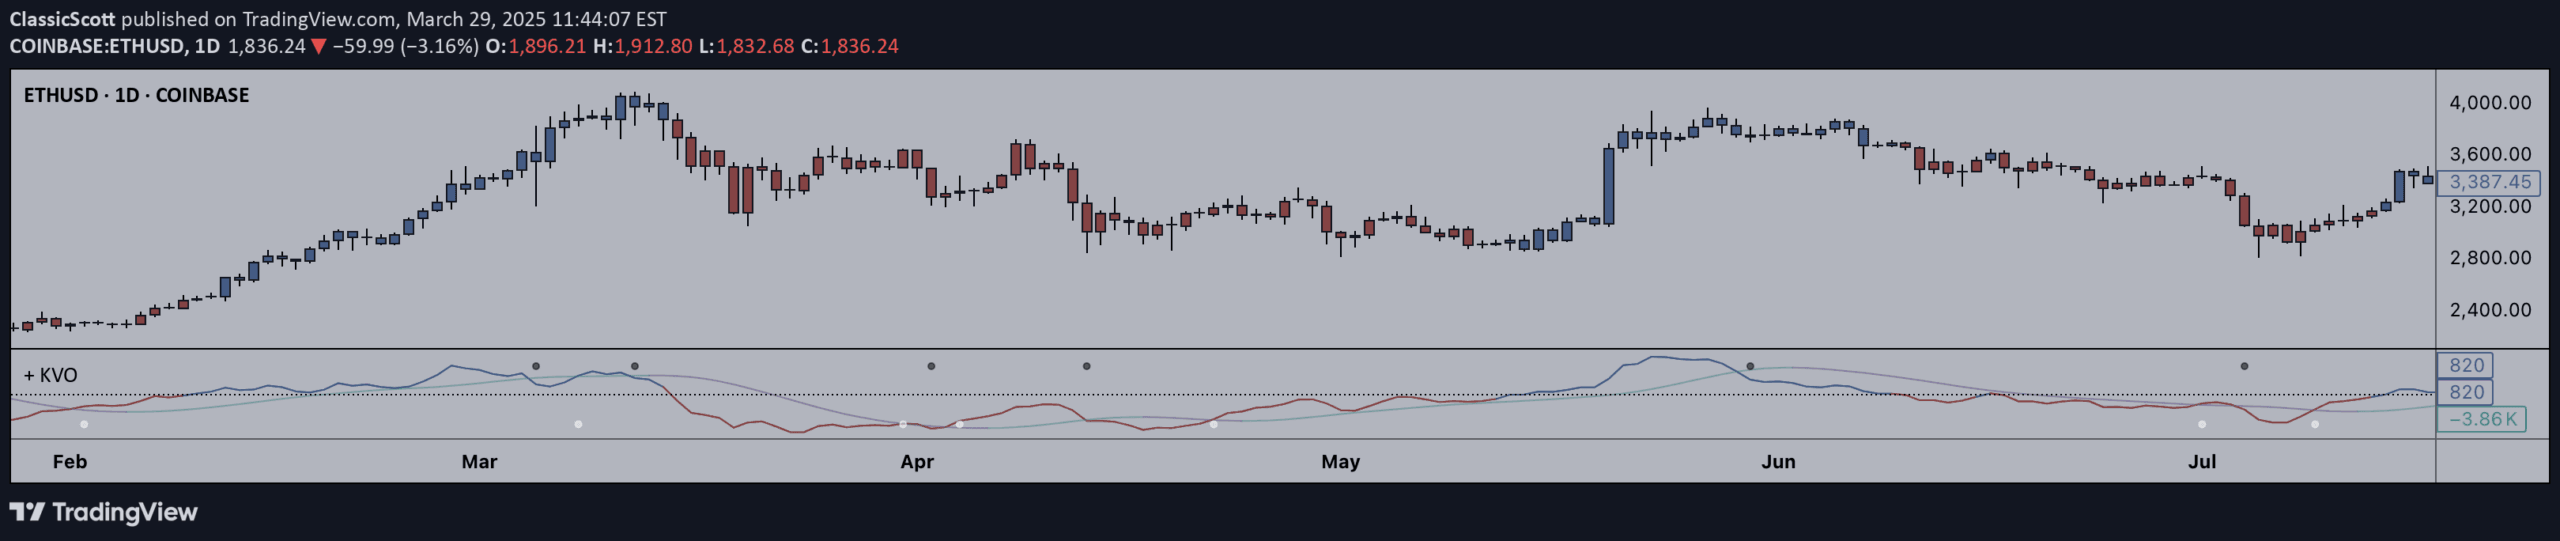
The Klinger Oscillator is a volume-based technical indicator that compares price changes and volume to determine potential trend reversals and market momentum.
Explore complementary indicator rolesHow it works
The Klinger Oscillator calculates volume flow by comparing current period's high, low, and close prices to the previous period. It determines volume trend by adding volume when prices increase and subtracting volume when prices decrease. The indicator creates an oscillator by calculating exponential moving averages of volume flow over different lookback periods and subtracting them.
Traders can use a signal line, typically a 13-period EMA, to generate trading signals. The oscillator can help identify potential trend changes and market momentum shifts. Alternative moving averages like ALMA or HMA can be used for the signal line
Why it may be useful
The Klinger Oscillator provides traders with a unique perspective on market dynamics by integrating price and volume information. It helps identify potential trend reversals and confirms market momentum through volume analysis. By comparing volume flow across different periods, traders can gain insights into potential buying or selling pressure.
The indicator offers flexibility with customizable moving average types for the signal line. Its ability to detect divergences between price and volume can signal potential trend changes before they become apparent in price movement
When to explore it
The Klinger Oscillator works best in markets with clear volume trends and significant price movements. It is most effective in liquid markets with consistent trading volume, such as major stock indices, forex pairs, and actively traded commodities. Traders should use the indicator in conjunction with other technical analysis tools to confirm signals.
The oscillator is particularly useful during trending markets and can help identify potential trend reversals. It performs well in timeframes ranging from daily to weekly charts. Combining the Klinger Oscillator with trend-following or momentum indicators can enhance its predictive power
Keep exploring
What we’ve verified
Access, alerts and repainting behaviour have not been independently verified for this indicator. Check the creator’s current publication and settings.
General descriptions and classifications are recovered research. Verified details above identify the specific checks we have completed. Check the creator’s current publication for later changes.