
#NAME?
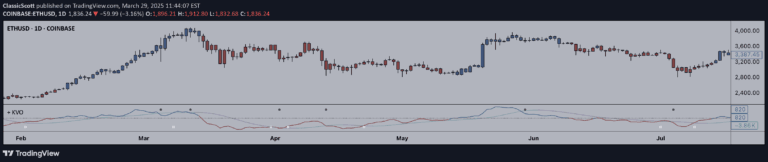
The Klinger Oscillator is a volume-based technical indicator that compares price changes and volume to determine potential trend reversals and market momentum.
Explore 11,183 indicators. Filter beyond the obvious.
Discover the tools that fit the way you trade.
11,183 tools to explore
The Klinger Oscillator is a volume-based technical indicator that compares price changes and volume to determine potential trend reversals and market momentum.
A custom trading indicator that allows users to modify candle colors within a specific intraday trading session, providing enhanced visual customization and highlighting key market periods.
An advanced volume analysis tool that measures volume density across multiple assets, providing insights into market maker activities and liquidity concentration in trading markets.
A stochastic oscillator indicator that identifies support and resistance zones by tracking when price exits overbought or oversold levels, with optional candle coloring and signal plotting.
A multi-timeframe volume Z-Score indicator that assesses volume significance by calculating deviation from historical average across different timeframes.
A dynamic chart bar coloring indicator that provides visual insights into time-based patterns by changing bar colors based on day, week, or hour modes.
A two-bar pattern matching indicator that compares current and previous bar values to identify potential price movement probabilities by analyzing historical pattern similarities.
Likes, views, and comments are historical TradingView snapshots. They describe attention, not trading performance.