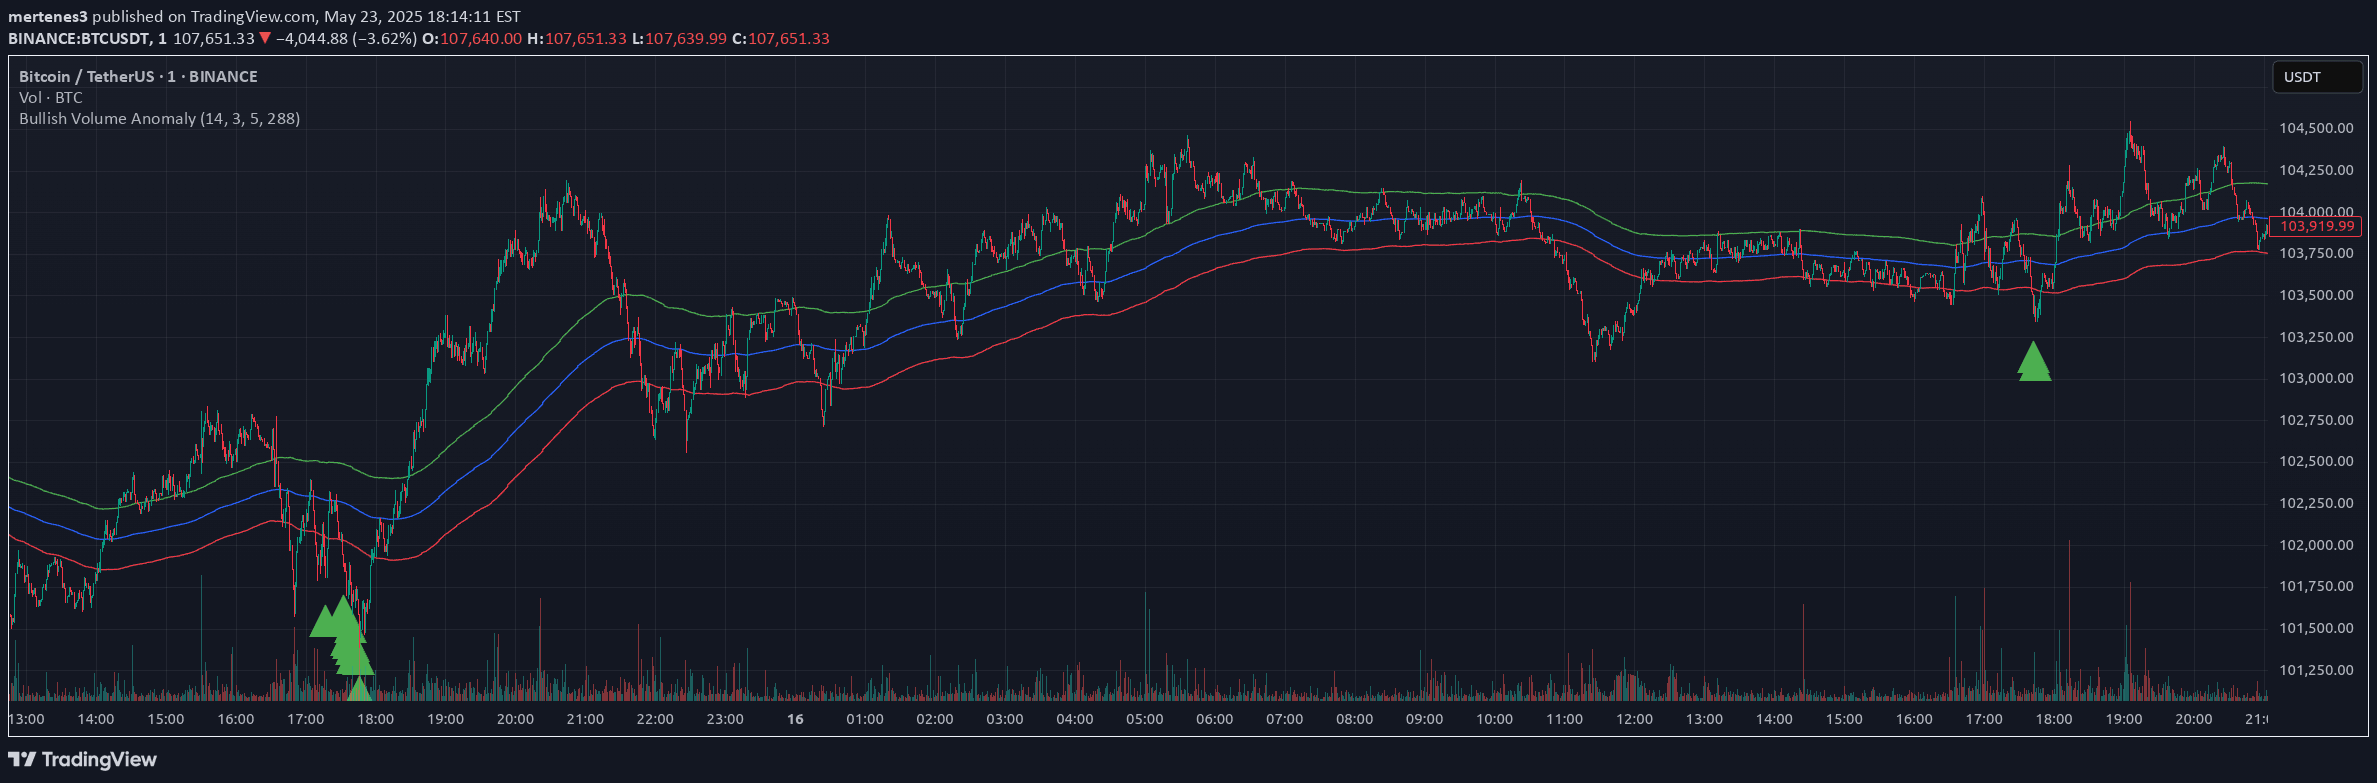
A multi-timeframe volume Z-Score indicator that assesses volume significance by calculating deviation from historical average across different timeframes.
Explore complementary indicator rolesHow it works
The indicator calculates Z-Scores for volume by comparing current volume to its historical mean and standard deviation across multiple timeframes. It dynamically computes this metric using a user-defined lookback period, allowing traders to understand how current volume deviates from typical trading activity.
By independently calculating Z-Scores for each timeframe, the script adapts to the current chart's timeframe and provides a comprehensive view of volume significance. The Z-Score is computed using the formula: (current volume - mean) / standard deviation, which normalizes volume data and helps identify statistically unusual trading volumes.
Why it may be useful
Volume analysis is crucial for understanding market momentum and potential trend reversals, as volume often precedes significant price movements. This indicator provides a quantitative approach to assessing volume dynamics, helping traders distinguish between normal and extraordinary trading activity.
By offering visual cues like color-coded volume indicators and Z-Score thresholds, the tool helps traders quickly identify significant volume events. The ability to detect massive buy or sell volume can provide early warning signals about potential market shifts, enabling more informed trading decisions.
When to explore it
This volume indicator is most effective in markets with clear trending characteristics and during periods of potential trend initiation or reversal. Traders can leverage it during key market sessions when volume tends to be more significant, such as market opens, economic news releases, or around major support and resistance levels.
The indicator is particularly useful for traders seeking to confirm trend strength, identify potential breakouts, or detect unusual market activity. It works best when combined with other technical analysis tools to validate volume-based signals and provide a more comprehensive market analysis.
Keep exploring
What we’ve verified
Access, alerts and repainting behaviour have not been independently verified for this indicator. Check the creator’s current publication and settings.
General descriptions and classifications are recovered research. Verified details above identify the specific checks we have completed. Check the creator’s current publication for later changes.