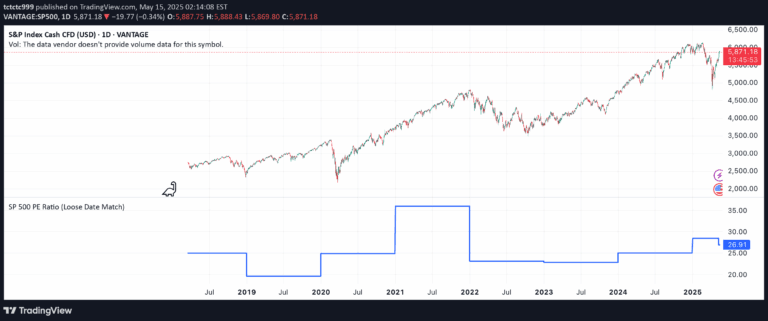
The S&P 500 Estimated PE Ratio indicator provides insights into market valuation by tracking forward-looking price-to-earnings ratios from historical data since 2008.
Explore complementary indicator rolesHow it works
The S&P 500 Estimated PE Ratio indicator imports daily historical data from an external CSV source, automatically aligning PE values to the closest available trading date. It calculates the forward-looking price-to-earnings ratio by dividing the current market price of the S&P 500 index by its estimated future earnings per share.
The indicator processes and visualizes these PE ratios, allowing traders to see how the market is valuing future corporate earnings potential. By tracking these values over time, investors can identify trends in market valuation and potential over or undervaluation periods.
Why it may be useful
The S&P 500 Estimated PE Ratio is crucial for understanding broader market sentiment and potential investment opportunities. It provides a macro-level view of market valuation, helping investors assess whether stocks are reasonably priced or potentially overvalued based on expected future earnings.
By offering a long-term perspective on market pricing, this indicator helps investors make more informed decisions about entry points and overall market conditions. It serves as a valuable tool for understanding the relationship between stock prices and anticipated corporate performance.
When to explore it
The S&P 500 Estimated PE Ratio is most effective for long-term investors and analysts seeking to understand broader market valuation trends. It is particularly useful during periods of market uncertainty or significant economic shifts when traditional valuation metrics may be less reliable.
Investors should use this indicator as part of a comprehensive analysis, combining it with other fundamental and technical indicators to form a holistic view of market conditions. It is especially valuable for those interested in macro-level investment strategies and long-term portfolio positioning.
Keep exploring
What we’ve verified
Access, alerts and repainting behaviour have not been independently verified for this indicator. Check the creator’s current publication and settings.
General descriptions and classifications are recovered research. Verified details above identify the specific checks we have completed. Check the creator’s current publication for later changes.