
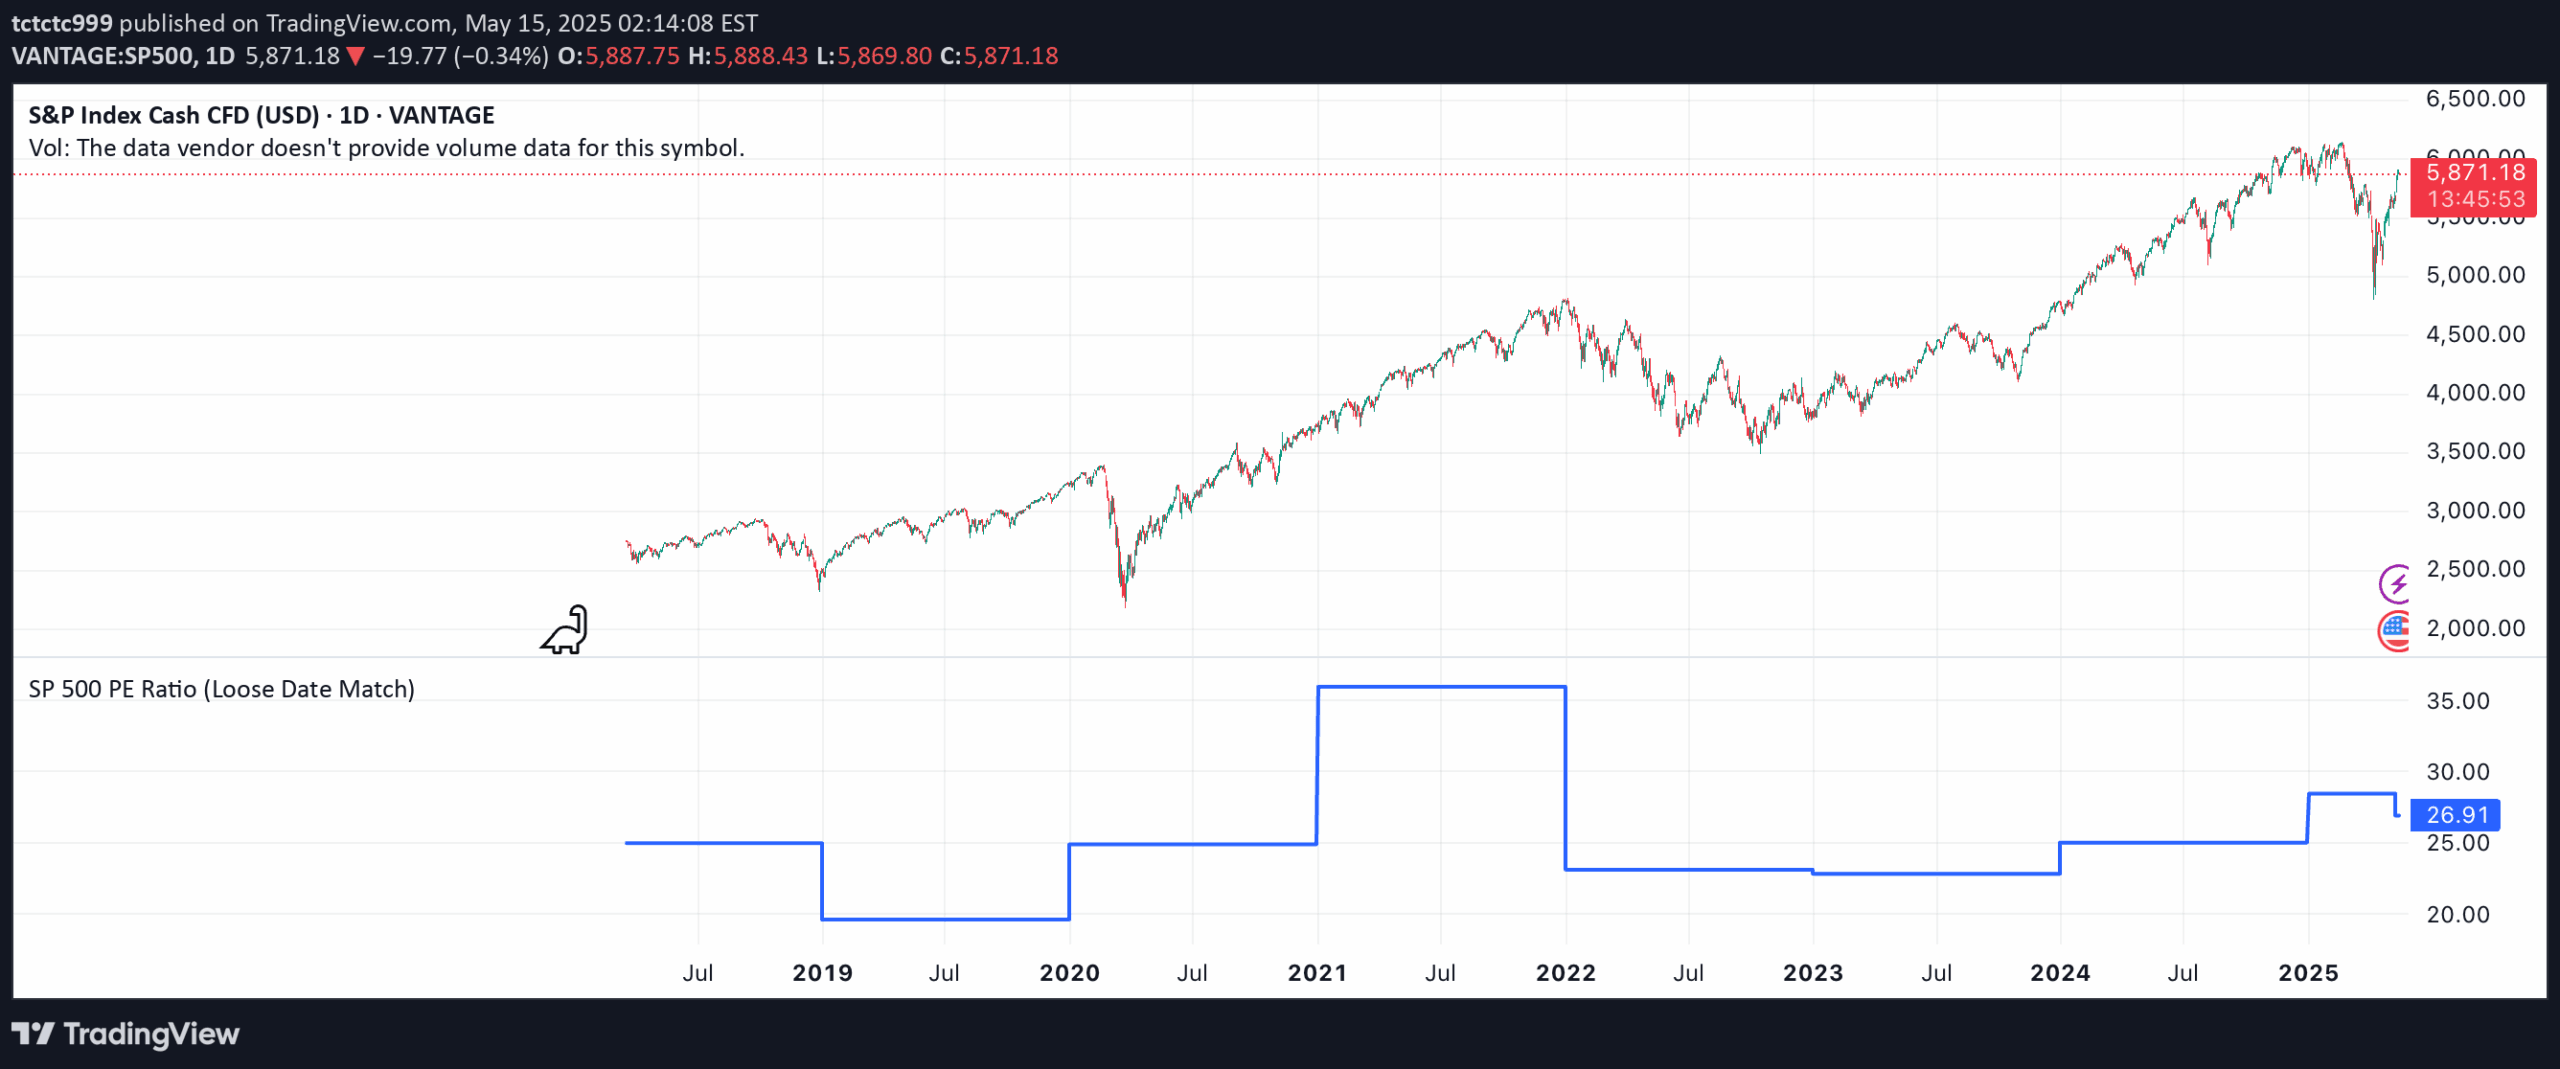
A custom indicator that visualizes the historical S&P 500 Price-to-Earnings (PE) Ratio from Excel data, providing insights into market valuation trends and potential entry/exit zones.
Explore complementary indicator rolesHow it works
The S&P 500 PE Ratio indicator loads historical price-to-earnings data from an Excel spreadsheet, plotting these values chronologically on a trading chart. It uses stepwise or linear rendering to account for missing trading days, ensuring a comprehensive view of market valuation over time.
The indicator transforms raw financial data into a visual representation, allowing traders to observe how the market's valuation has changed across different periods. By tracking these PE ratio values, the tool helps investors understand the relationship between a company's earnings and its market price.
Why it may be useful
The PE Ratio indicator provides crucial insights into market valuation, helping traders assess whether stocks are potentially overvalued or undervalued at different points in time. By understanding historical valuation trends, investors can make more informed decisions about market entry and exit points.
This tool bridges the gap between raw financial data and actionable market intelligence, enabling traders to contextualize current market conditions within broader historical trends. It offers a long-term perspective that complements more short-term technical analysis methods.
When to explore it
The S&P 500 PE Ratio indicator is most effective for long-term market analysis and strategic investment planning. It's particularly useful for investors looking to understand broader market cycles and make informed decisions about portfolio allocation and timing.
Traders can leverage this indicator during periods of market uncertainty or when seeking to compare current market valuations with historical benchmarks. It's especially valuable for swing traders and investors who prioritize fundamental analysis and long-term market trends.
Keep exploring
What we’ve verified
Access, alerts and repainting behaviour have not been independently verified for this indicator. Check the creator’s current publication and settings.
General descriptions and classifications are recovered research. Verified details above identify the specific checks we have completed. Check the creator’s current publication for later changes.


