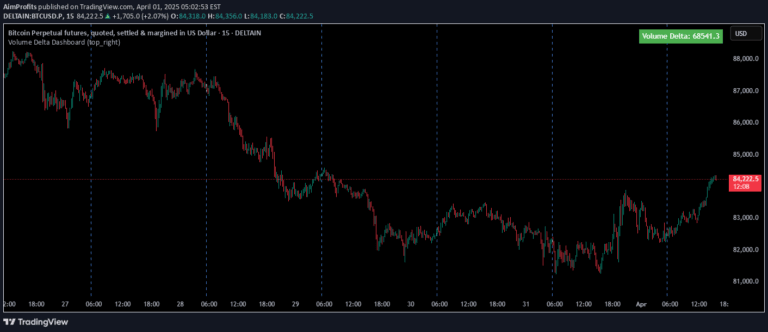
A dynamic volume indicator that breaks down buy and sell volume proportions within each candle, showing real-time volume distribution and highlighting which side dominates trading activity.
Explore complementary indicator rolesHow it works
The indicator calculates buy and sell volume percentages by analyzing the price movement within each trading candle. It determines buy volume by measuring the distance from the candle's low to its close, and sell volume by measuring the distance from the candle's high to its close, proportional to the total candle range.
By dynamically stacking volume sides, the indicator visually represents which trading side - buyers or sellers - is currently more dominant. A real-time percentage label provides immediate insight into the current candle's volume distribution, allowing traders to quickly assess market sentiment and potential directional momentum.
Why it may be useful
This volume indicator provides traders with a nuanced view of market participation beyond traditional static volume representations. By dynamically showing which side has higher volume, it offers immediate insights into potential trend strength and market sentiment that static indicators might miss.
The real-time percentage breakdown helps traders understand the underlying buying and selling pressure within each candle, potentially signaling shifts in market dynamics before they become apparent through price movement alone. This granular view can be crucial for making more informed trading decisions, especially in volatile or rapidly changing market conditions.
When to explore it
The indicator is most effective during periods of active trading with clear price movement and meaningful volume. It works particularly well in markets with high liquidity, such as major forex pairs, popular stock indices, and cryptocurrencies where volume fluctuations are more pronounced and meaningful.
Traders should use this signal during trending markets, breakout scenarios, and when looking to confirm potential trend reversals. It is especially useful for short-term trading strategies like scalping and day trading, where quick assessment of market sentiment can provide a critical edge in decision-making.
Keep exploring
What we’ve verified
Access, alerts and repainting behaviour have not been independently verified for this indicator. Check the creator’s current publication and settings.
General descriptions and classifications are recovered research. Verified details above identify the specific checks we have completed. Check the creator’s current publication for later changes.