
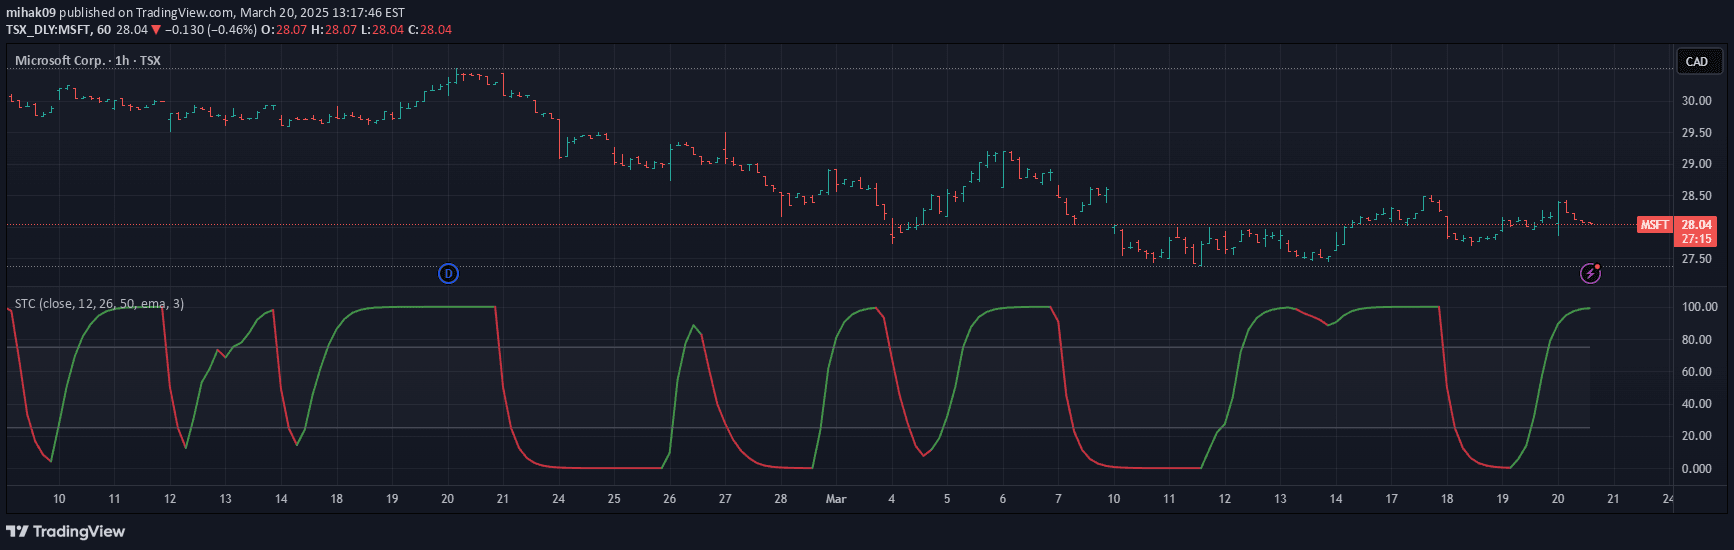
The STC indicator is a dynamic momentum oscillator that combines MACD and stochastic techniques to identify market cycles, trend reversals, and potential trading opportunities with enhanced signal filtering.
Explore complementary indicator rolesHow it works
The Schaff Trend Cycle (STC) indicator operates by integrating MACD and stochastic principles to generate a responsive momentum oscillator. It calculates values between 0 and 100, with specific thresholds at 25 and 75 indicating potential oversold and overbought conditions.
The indicator applies multiple smoothing techniques like EMA, sigmoid, and digital smoothing to reduce market noise. By comparing the STC value against its 5-period EMA, the indicator dynamically color-codes momentum as green or red, providing visual trend insights. Signal line crossovers and extreme readings help traders identify potential trend reversals
Why it may be useful
The STC indicator matters because it provides traders with a sophisticated momentum analysis tool that goes beyond traditional oscillators. By combining multiple technical analysis techniques, it offers more nuanced market cycle identification. The indicator helps filter out false signals in choppy market conditions, reducing unnecessary trades.
Its dynamic smoothing options allow traders to customize sensitivity based on their trading style. The color-coded visualization makes trend momentum instantly recognizable, facilitating quicker decision-making. The built-in overbought and oversold zones provide clear entry and exit guidelines
When to explore it
The STC indicator works best in trending markets with clear directional movement. It is particularly effective for swing and day traders seeking to identify potential trend reversals and confirm existing trends. Traders should use the STC when markets show consistent momentum rather than in highly choppy or range-bound conditions.
It performs optimally when combined with other technical indicators for confirmation. The indicator is most reliable on timeframes from 1-hour to daily charts. Traders should pay special attention to signal line crossovers and extreme readings near the 25 and 75 levels
Keep exploring
What we’ve verified
Access, alerts and repainting behaviour have not been independently verified for this indicator. Check the creator’s current publication and settings.
General descriptions and classifications are recovered research. Verified details above identify the specific checks we have completed. Check the creator’s current publication for later changes.





