
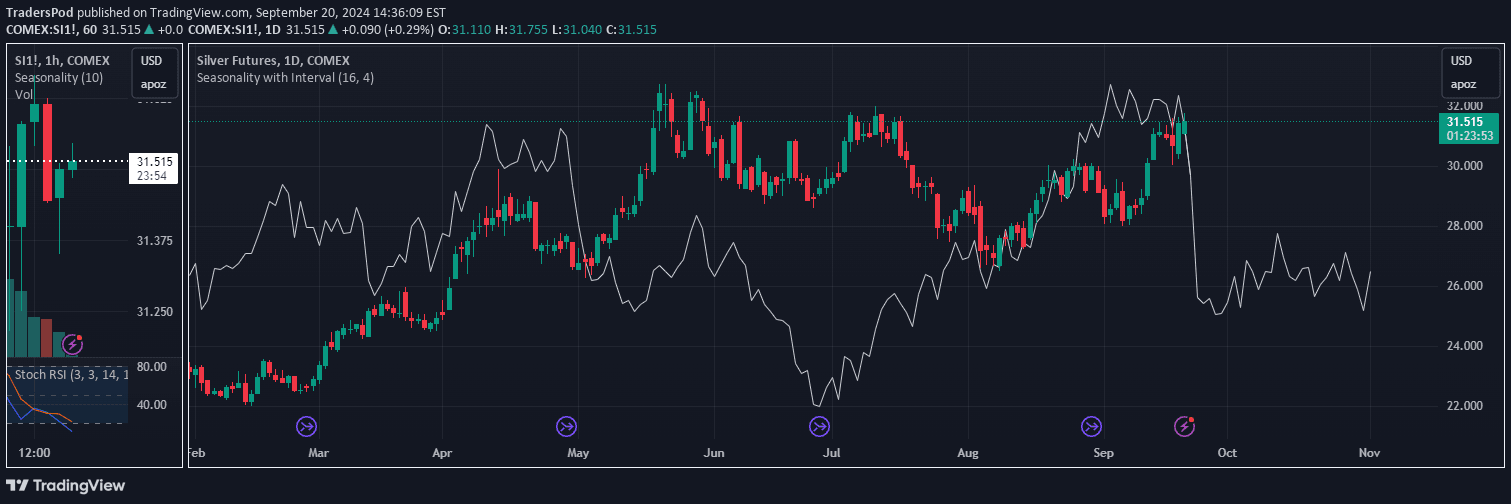
A customizable seasonal trend analysis tool that helps traders understand market price movements across different time intervals by analyzing historical price patterns and projecting future trends.
Explore complementary indicator rolesHow it works
The seasonal trend indicator calculates average price changes for specific trading periods by analyzing historical data across multiple years. It uses a configurable lookback period where traders can select the number of years to analyze, ranging from a few years to up to 30 years.
The script then processes this data to generate a smoothed seasonal trend line, which can be projected into future trading periods. By applying customizable parameters like interval years and smoothing, traders can focus on specific market cycles such as election years or decadal trends, providing a nuanced view of potential price movements.
Why it may be useful
Seasonal trend analysis offers traders a sophisticated method of understanding long-term market behavior beyond short-term price fluctuations. By revealing recurring patterns across different timeframes, the indicator helps traders identify potential market cycles and anticipate future price movements based on historical data.
This approach provides a strategic advantage by offering insights into how markets typically behave during specific periods, allowing traders to make more informed decisions. The flexibility of customizing lookback periods and intervals makes this tool adaptable to various markets and trading strategies.
When to explore it
This seasonal trend indicator is most effective for traders focused on longer-term market analysis and those interested in understanding cyclical market behaviors. It works particularly well for markets with strong seasonal patterns, such as commodities, stock indices, and certain sector-specific securities.
Traders should use this tool when they want to complement their existing technical analysis with a broader, more historical perspective on price movements. It is especially valuable for swing traders and investors who are looking to identify potential trends that repeat over multiple years, such as election cycles or decadal market patterns.
Keep exploring
What we’ve verified
Access, alerts and repainting behaviour have not been independently verified for this indicator. Check the creator’s current publication and settings.
General descriptions and classifications are recovered research. Verified details above identify the specific checks we have completed. Check the creator’s current publication for later changes.


