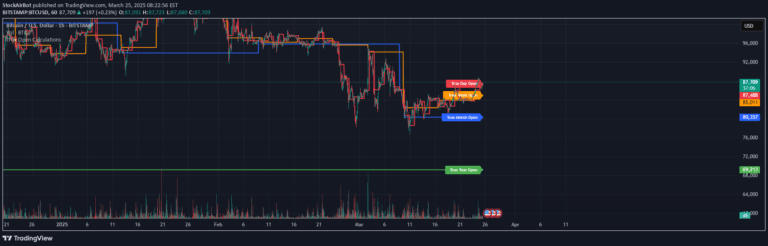
A seasonal chart overlay that calculates average daily percentage changes across multiple years, providing insights into potential seasonal price movements and trends.
Explore complementary indicator rolesHow it works
The seasonal chart overlay begins by calculating the percentage change from each closing price across different years. These daily percentage changes are then averaged for each trading day, creating a cumulative chart that reveals typical price movement patterns.
The method employs a trimmed mean approach to reduce the impact of extreme outliers, such as significant market events. By analyzing historical data, the overlay attempts to smooth out anomalous price movements and provide a more representative view of seasonal price trends.
Why it may be useful
Seasonal charts help traders understand recurring market patterns and potential cyclical behaviors that might not be immediately apparent in raw price data. By aggregating percentage changes across multiple years, traders can identify consistent trends and potential seasonal influences on price movements.
The trimmed mean technique adds an additional layer of statistical refinement, helping to mitigate the distorting effects of extreme market events. This approach provides a more balanced and reliable perspective on seasonal price dynamics, which can be valuable for developing trading strategies and making informed investment decisions.
When to explore it
This seasonal chart overlay is most effective when applied to daily timeframes for traditional financial instruments with consistent trading histories. It works best with assets that have stable trading patterns and minimal interruptions in market data.
Traders should be cautious when using this overlay with instruments that have incomplete historical data or significant gaps in trading records. It is particularly useful for swing trading strategies that aim to capture multi-day or multi-week price trends based on historical seasonal patterns.
Keep exploring
What we’ve verified
Access, alerts and repainting behaviour have not been independently verified for this indicator. Check the creator’s current publication and settings.
General descriptions and classifications are recovered research. Verified details above identify the specific checks we have completed. Check the creator’s current publication for later changes.