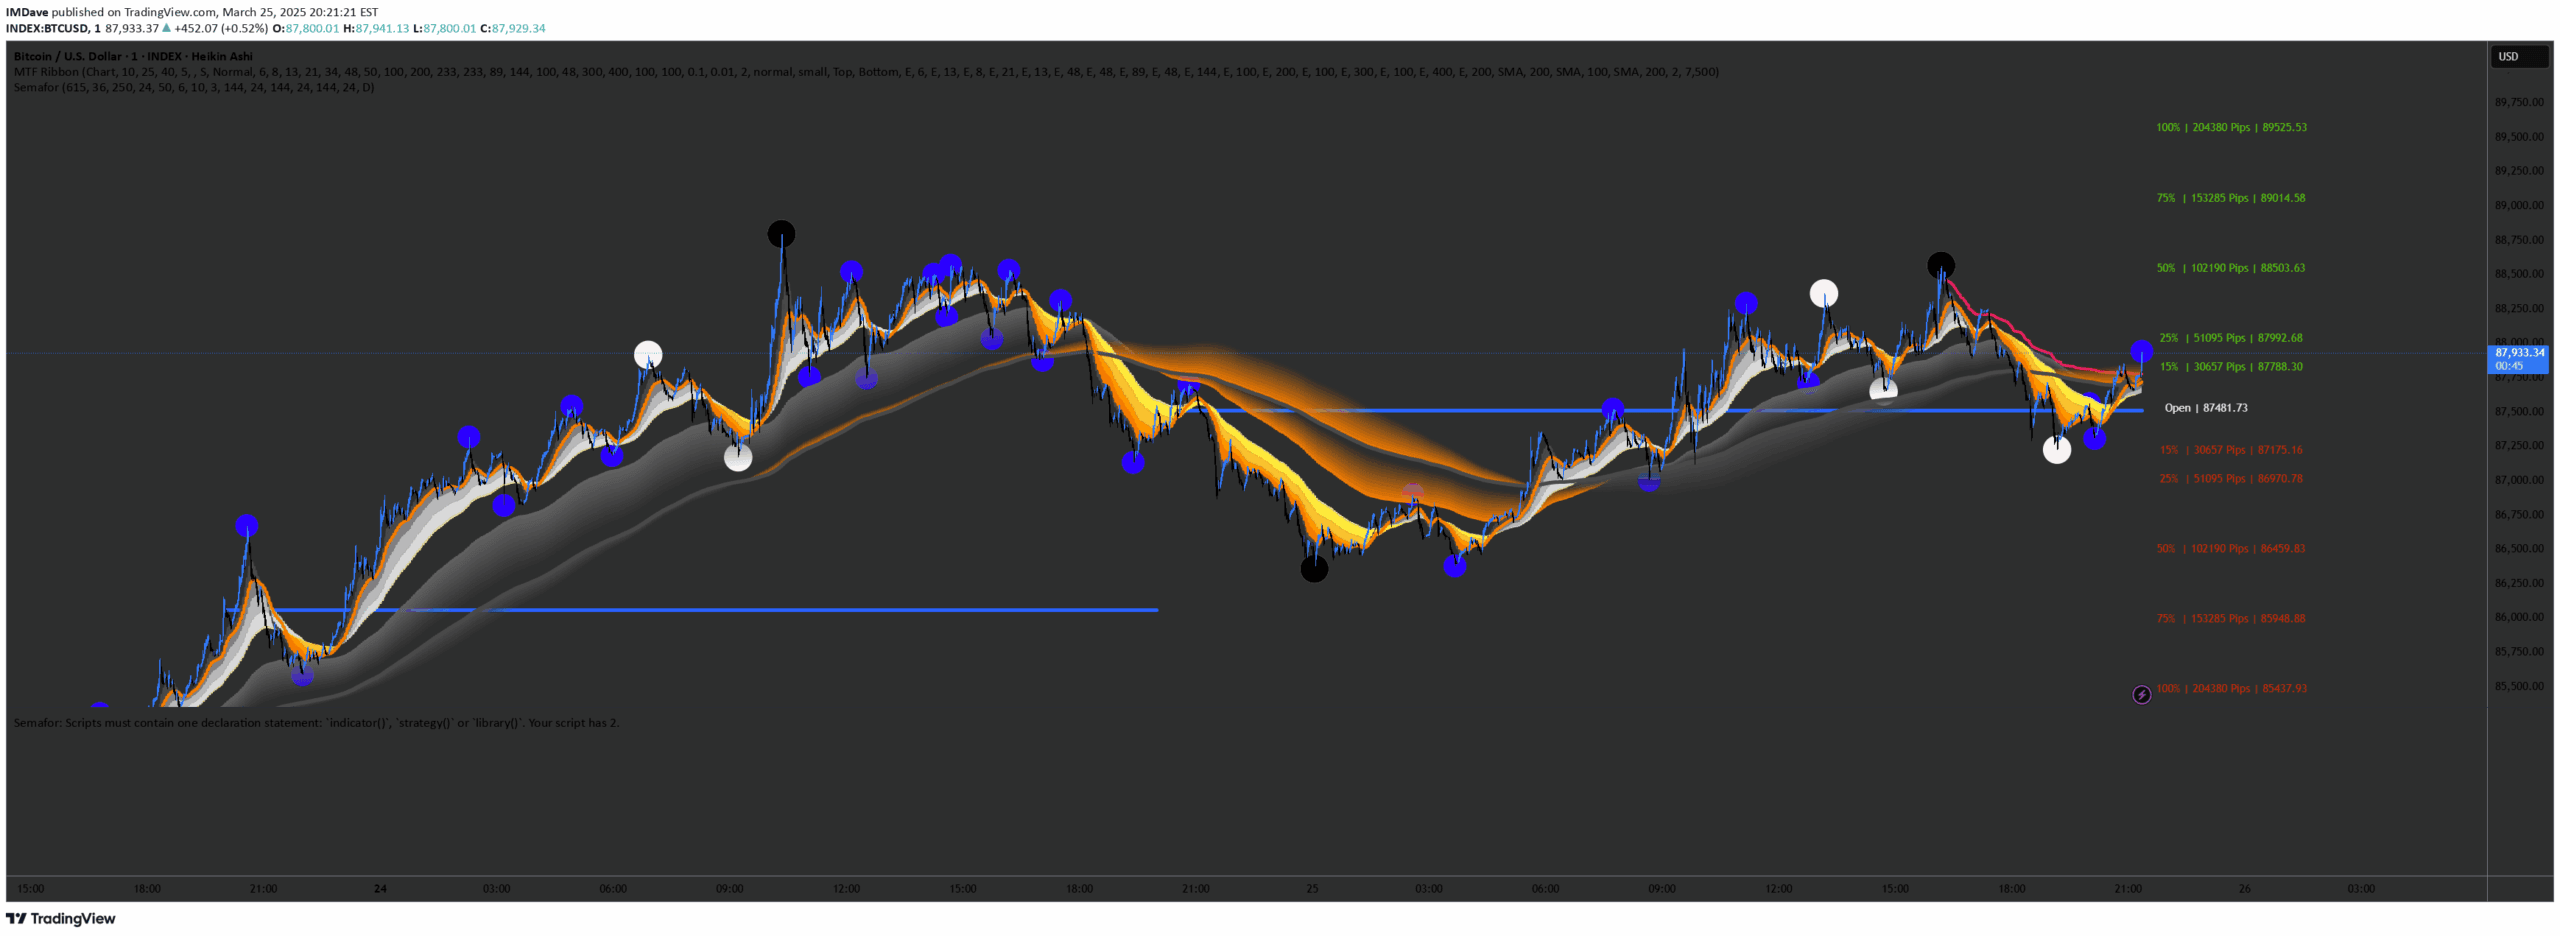
A multi-level Semafor indicator combining ZigZag patterns with multiple period semaphores to identify potential market trends and turning points through strategic dot placement.
Explore complementary indicator rolesHow it works
The Semafor indicator uses ZigZag principles to plot colored dots representing different time periods (10, 50, 250, and 615). Traders look for specific dot patterns, particularly a large white dot followed by blue dots in opposite and then confirming directions.
The indicator recalculates as new candles form, providing dynamic market structure insights. Multiple period semaphores help identify potential trend changes and market movements by highlighting higher highs and lower lows across different timeframes
Why it may be useful
This indicator provides traders with a nuanced view of market structure by combining multiple timeframe perspectives. It helps identify potential trend reversals and momentum shifts more accurately than single-period indicators.
By integrating multiple semafor periods, traders can gain deeper insights into market dynamics, reducing false signal risks. The approach allows for more comprehensive market analysis by considering both short-term and long-term price movements simultaneously
When to explore it
The Semafor indicator works best when combined with other technical analysis tools like Daily Open Line, Average Session Range, and EMA crosses. It is most effective in trending markets with clear directional movements.
Traders should use it on multiple timeframes to confirm signals, particularly when looking for potential trend reversals. It is particularly useful for day and swing traders seeking to identify precise entry and exit points with enhanced confirmation methods
Keep exploring
What we’ve verified
Access, alerts and repainting behaviour have not been independently verified for this indicator. Check the creator’s current publication and settings.
General descriptions and classifications are recovered research. Verified details above identify the specific checks we have completed. Check the creator’s current publication for later changes.