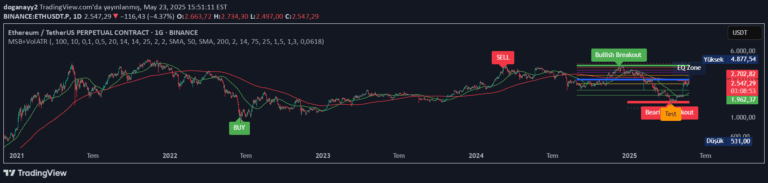
A Pine Script indicator that visually highlights specific trading sessions by applying unique colors to chart bars, helping traders identify and analyze critical market timeframes and price movements.
Explore complementary indicator rolesHow it works
The Session Coloring Bar works by allowing traders to define custom trading sessions with specific start and end times. Users can configure up to three unique sessions, each with individual color settings for upward and downward price bars.
The indicator automatically applies predefined colors to bars falling within these specified timeframes, providing visual differentiation. It can track 24-hour macro sessions and filter visibility based on selected timeframes. The dynamic color logic changes bar colors according to price direction, making market session analysis more intuitive and straightforward
Why it may be useful
This indicator matters because it transforms complex trading session data into an easily digestible visual format. By color-coding bars during specific timeframes, traders can quickly identify market behaviors and potential trading opportunities.
It helps traders focus on critical periods like overnight sessions, regional market hours, and specific macro timeframes. The visual enhancement allows for faster pattern recognition and more efficient market analysis without overwhelming chart information. Traders can customize sessions to match their specific trading strategies and time zones
When to explore it
The Session Coloring Bar is most effective when analyzing markets with distinct trading sessions, such as forex, futures, or cryptocurrencies. It works best for traders who want to understand market dynamics during specific timeframes like Asian, European, or US trading hours.
Ideal for identifying low-liquidity periods, tracking regional market behaviors, and focusing on critical session transitions. Particularly useful for day traders and swing traders who need to quickly understand market context and potential price movements within defined time windows
Keep exploring
What we’ve verified
Access, alerts and repainting behaviour have not been independently verified for this indicator. Check the creator’s current publication and settings.
General descriptions and classifications are recovered research. Verified details above identify the specific checks we have completed. Check the creator’s current publication for later changes.