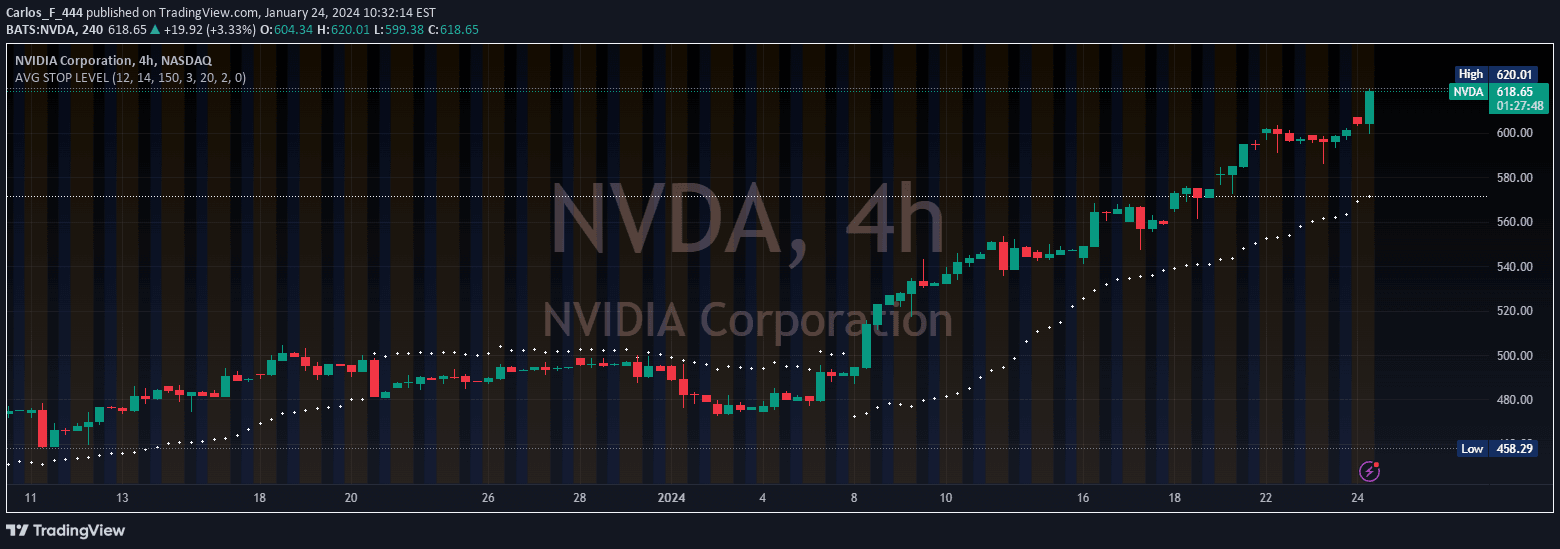
A trading indicator that measures average price movement from session open, analyzing market volatility by tracking high and low price distances across multiple sessions.
Explore complementary indicator rolesHow it works
The Session High/Low Average & Range indicator calculates average price movements by measuring the distance between the session's opening price and its highest and lowest points. It computes separate averages for upward and downward price movements, creating multiple lines at 1x, 2x, and 3x multiples to represent potential price ranges.
The indicator samples a specified number of previous sessions to generate these average lines, allowing traders to visualize potential price expansion and contraction. By displaying customizable lines and ranges, it provides a visual representation of market volatility and potential price movement boundaries.
Why it may be useful
This indicator helps traders understand market volatility by providing a dynamic view of price movement ranges across multiple sessions. It offers insights into potential price expansion and contraction, enabling traders to make more informed decisions about entry and exit points.
By displaying average lines and ranges, the indicator helps traders identify potential support and resistance levels, assess market momentum, and develop more strategic trading approaches. The customizable nature of the lines allows for flexible analysis across different trading styles and market conditions.
When to explore it
The Session High/Low Average & Range indicator is most effective during active trading sessions with clear price movements and defined market trends. It works best in markets with consistent volatility, such as forex, futures, and actively traded stocks where price ranges can be readily identified.
Traders should use this indicator when seeking to understand potential price movement boundaries, assess market volatility, and develop precise entry and exit strategies. It is particularly useful for short-term trading approaches that require quick analysis of price range dynamics.
Keep exploring
What we’ve verified
Access, alerts and repainting behaviour have not been independently verified for this indicator. Check the creator’s current publication and settings.
General descriptions and classifications are recovered research. Verified details above identify the specific checks we have completed. Check the creator’s current publication for later changes.