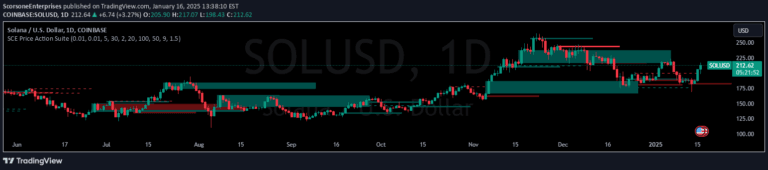
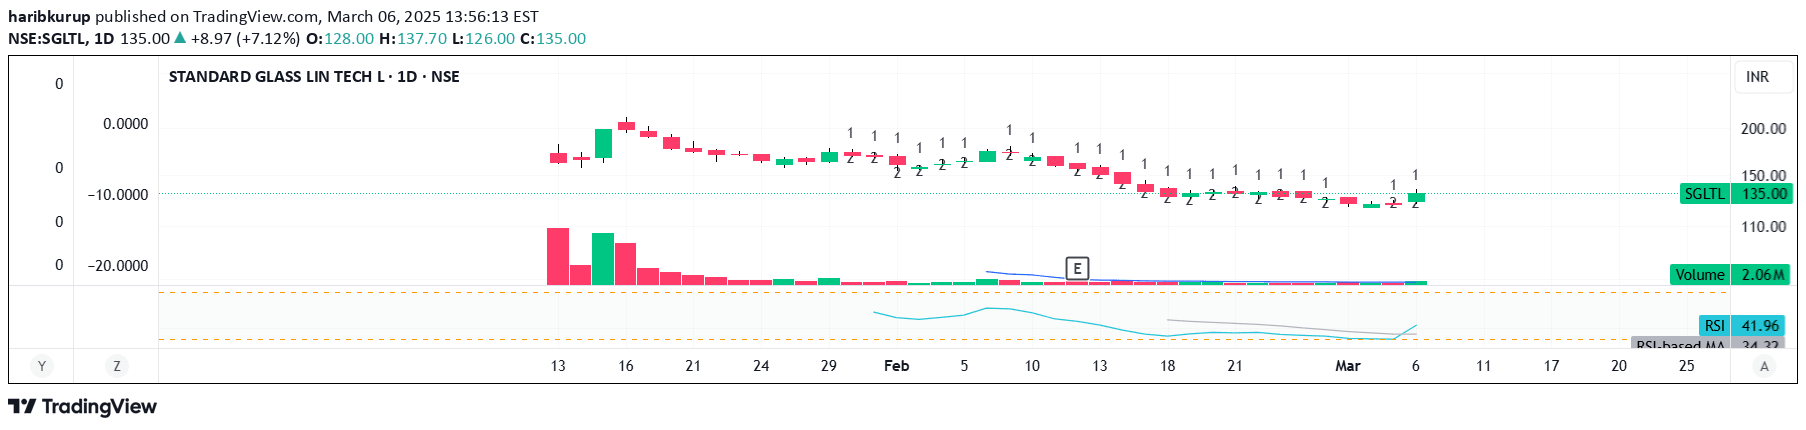
A short-term trading signal that identifies market continuations through imbalance candles and subsequent consolidation patterns, revealing potential trend momentum and institutional interest.
Explore complementary indicator rolesHow it works
The indicator first identifies an imbalance candle where the price action demonstrates a strong one-sided orderflow, creating a significant price movement. This initial candle is characterized by a low above the previous candle's high (bearish) or a high below the previous candle's low (bullish).
Following the imbalance candle, the signal looks for 1-2 inside candles in the same direction, which represent a consolidation phase. These inside candles confirm that the opposing market participants cannot immediately reverse the momentum, indicating continued strength in the original price movement and potentially signaling a continuation of the current trend.
Why it may be useful
This signal provides traders with insights into market dynamics by revealing potential trend continuations and institutional trading behavior. By identifying moments of strong orderflow and subsequent controlled consolidation, traders can gain a deeper understanding of market sentiment and potential price movements.
The indicator helps traders recognize when large market participants might be accumulating or distributing positions, offering a window into more sophisticated trading strategies. By highlighting these nuanced price action patterns, the signal can help traders make more informed decisions about potential entry points and trend reliability.
When to explore it
The signal is most effective when used in conjunction with the overall higher timeframe trend, providing additional confirmation of potential price movements. It works best in markets with clear directional momentum, where price action shows distinct orderflow characteristics and consolidation patterns.
Traders should apply this signal at important price zones, such as support and resistance levels, trend reversal areas, or key technical levels. It is particularly useful for identifying potential entry points during pullbacks in trending markets and for confirming the continuation of existing market momentum.
Keep exploring
What we’ve verified
Access, alerts and repainting behaviour have not been independently verified for this indicator. Check the creator’s current publication and settings.
General descriptions and classifications are recovered research. Verified details above identify the specific checks we have completed. Check the creator’s current publication for later changes.