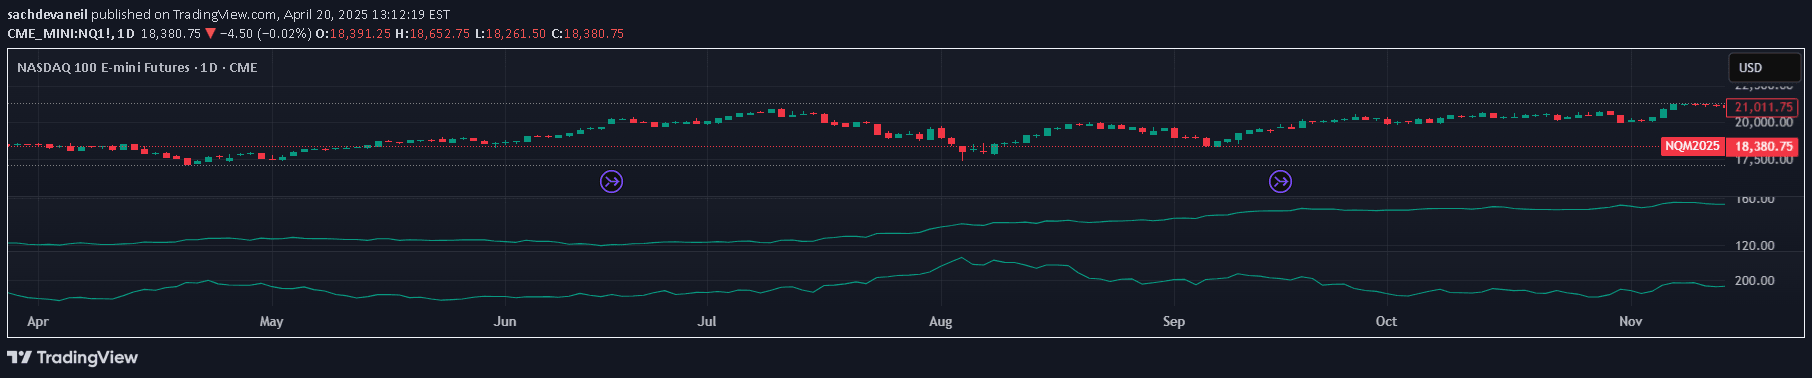
A trading indicator that identifies sideways market conditions by calculating the price range and comparing it against a specified maximum threshold, marking session boundaries with red triangles.
Explore complementary indicator rolesHow it works
The indicator calculates the price range by subtracting the low price from the high price during a trading session. It compares this range against a predefined maximum range threshold to determine whether the market is experiencing sideways conditions.
When the price range falls within the specified threshold, the indicator triggers a visual signal by changing the background color to blue with 90% transparency. This helps traders quickly identify periods of low volatility and potential consolidation in the market.
Why it may be useful
Identifying sideways market conditions is crucial for traders because it signals a period of price consolidation where directional momentum is minimal. By recognizing these phases, traders can adjust their strategies to avoid potential false breakouts and wait for more decisive price movements.
The visual indicators, such as the blue background and red triangles marking session boundaries, provide an intuitive and immediate way for traders to understand market dynamics without complex calculations or interpretation.
When to explore it
This indicator is most effective during periods of market uncertainty when traders want to quickly assess whether prices are trending or consolidating. It works particularly well in shorter timeframes where rapid market condition changes are more likely to occur.
Traders should use this signal when they want to minimize trading during low-volatility periods and focus on more active market sessions with clearer directional movements. It's especially useful for scalpers and day traders who rely on identifying precise market states.
Keep exploring
What we’ve verified
Access, alerts and repainting behaviour have not been independently verified for this indicator. Check the creator’s current publication and settings.
General descriptions and classifications are recovered research. Verified details above identify the specific checks we have completed. Check the creator’s current publication for later changes.