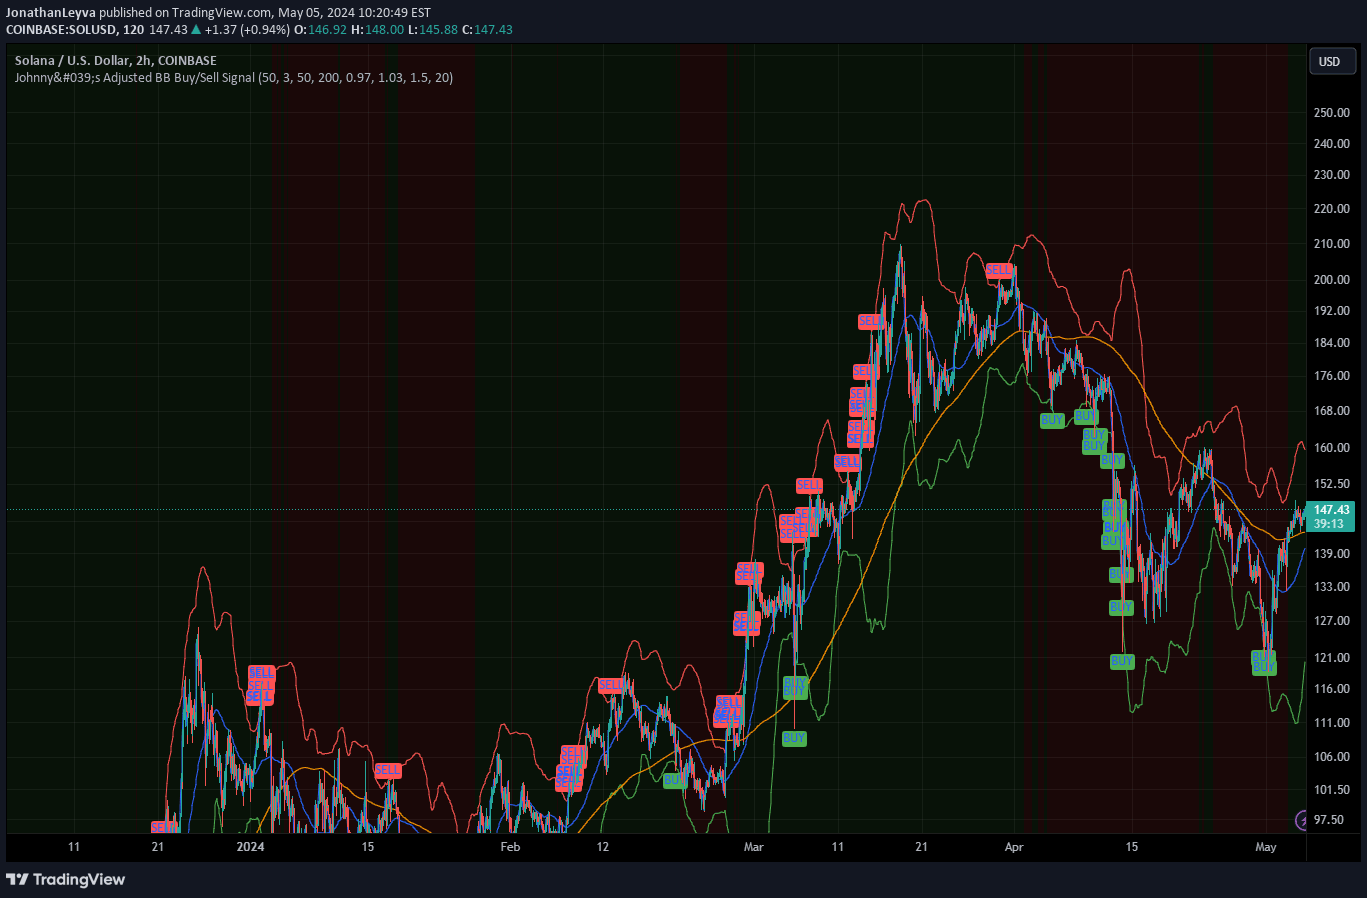
A moving average strategy with a price filter that generates buy and sell signals when price crosses a 200-day SMA by a specific percentage threshold.
Explore complementary indicator rolesHow it works
The moving average strategy uses a 200-day Simple Moving Average (SMA) as a baseline for generating entry and exit signals. When the closing price of an asset moves 3% above the 200-day SMA, a buy signal is triggered. Conversely, when the closing price drops 3% below the 200-day SMA, a sell signal is generated.
This approach adds a price filter to reduce market noise and minimize false signals. By requiring the price to move a specific percentage beyond the moving average, traders can avoid premature or unnecessary trades that often occur with traditional moving average crossover strategies.
Why it may be useful
The strategy provides a more refined approach to trend following by incorporating a percentage-based filter that reduces market whipsaws and false signals. It helps traders make more informed decisions by requiring a meaningful price movement beyond the moving average before generating a trade signal.
By using a 200-day SMA with a percentage filter, traders can potentially capture longer-term trends while minimizing the impact of short-term market fluctuations. This method can be particularly useful for investors seeking a systematic approach to trend identification and trade management.
When to explore it
This strategy works best in markets with clear, sustained trends where price movements are more likely to follow a consistent direction. It is particularly effective for swing traders and long-term investors who are interested in capturing multi-day or multi-week price movements.
The indicator is most suitable for assets with relatively stable and predictable price behavior, such as major stock indices, blue-chip stocks, or ETFs. Traders should be cautious when applying this strategy to highly volatile or range-bound markets where price movements may not consistently respect the moving average.
Keep exploring
What we’ve verified
Access, alerts and repainting behaviour have not been independently verified for this indicator. Check the creator’s current publication and settings.
General descriptions and classifications are recovered research. Verified details above identify the specific checks we have completed. Check the creator’s current publication for later changes.