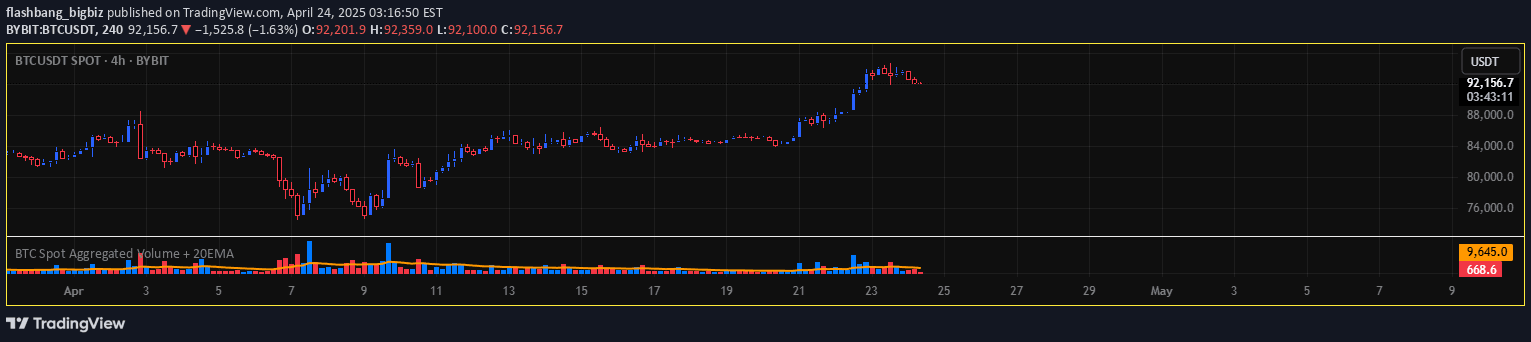
A custom volume analysis tool that tracks trading volume relative to a 200-period Simple Moving Average, providing insights into volume trends and potential price movements.
Explore complementary indicator rolesHow it works
The SMA Custom Volume Bands indicator operates by first calculating the 200-period Simple Moving Average of trading volume, which serves as a baseline for volume analysis. It then plots colored volume bars that distinguish between days with increasing (green) and decreasing (red) trading volume, providing a visual representation of volume dynamics.
The indicator allows users to set a custom percentage threshold above or below the 200 SMA volume line, enabling traders to create personalized volume measurement criteria. This custom line helps identify when trading volume deviates significantly from its average, potentially signaling important market movements or trend changes.
Why it may be useful
Volume is a critical indicator of market sentiment and potential price movements, offering traders insights into the strength and conviction behind price trends. By visualizing volume in relation to its moving average, traders can better understand the underlying market dynamics and identify potential trend reversals or continuations.
The customizable nature of this indicator allows traders to adapt their volume analysis to specific market conditions and personal trading strategies. It provides a flexible tool for assessing market participation and momentum, helping traders make more informed decisions about entry and exit points.
When to explore it
The SMA Custom Volume Bands indicator is most effective during periods of significant market activity or when traders want to confirm potential trend changes. It works particularly well in markets with clear volume patterns and during times of increased trading activity, such as earnings announcements or major economic events.
Traders should use this indicator in conjunction with other technical analysis tools to validate signals and reduce false positives. It is especially useful for identifying potential trend reversals, confirming breakouts, and understanding the underlying strength of price movements across various timeframes and market conditions.
Keep exploring
What we’ve verified
Access, alerts and repainting behaviour have not been independently verified for this indicator. Check the creator’s current publication and settings.
General descriptions and classifications are recovered research. Verified details above identify the specific checks we have completed. Check the creator’s current publication for later changes.