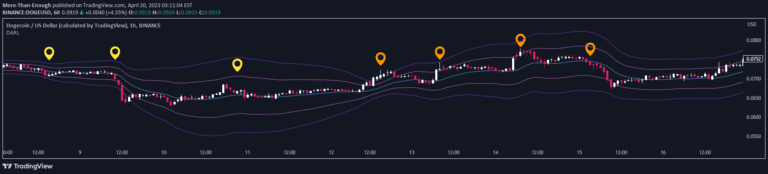
A comprehensive trading indicator combining Simple Moving Average smoothing with Standard Deviation analysis to detect market trends and volatility changes effectively.
Explore complementary indicator rolesHow it works
The Sma Standard Deviation indicator calculates a Simple Moving Average over a specified length, providing a smoothed price trend baseline. It simultaneously measures the standard deviation of price movements around this moving average, creating upper and lower volatility boundaries.
The script integrates Double Exponential Moving Average (DEMA) smoothing to refine trend analysis and generate more precise signals. By monitoring crossovers between the DEMA, SMA, and standard deviation boundaries, the indicator identifies potential trend shifts and volatility breakouts.
Why it may be useful
This indicator offers traders a sophisticated tool for understanding market dynamics by simultaneously tracking trend direction and price volatility. It helps filter out short-term market noise and provides a more comprehensive view of potential price movements.
By combining trend detection with volatility analysis, traders can make more informed decisions about market entry and exit points. The integrated approach allows for better risk management and more nuanced interpretation of market conditions.
When to explore it
The Sma Standard Deviation indicator is most effective in markets experiencing moderate to high volatility where clear trend identification is challenging. It works exceptionally well in markets with distinct trending characteristics, helping traders recognize potential trend reversals and momentum shifts.
Traders can leverage this indicator across various timeframes, from scalping to swing trading, making it a versatile tool for different trading strategies. It is particularly useful when looking to confirm trend strength and detect early signs of potential market transitions.
Keep exploring
What we’ve verified
Access, alerts and repainting behaviour have not been independently verified for this indicator. Check the creator’s current publication and settings.
General descriptions and classifications are recovered research. Verified details above identify the specific checks we have completed. Check the creator’s current publication for later changes.