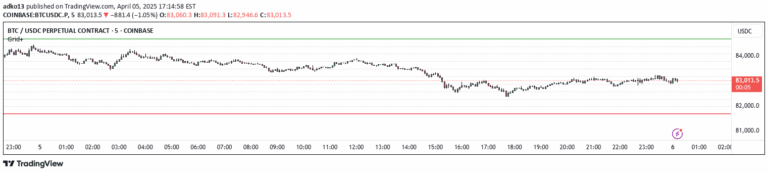
A dynamic channel indicator using Pearson's correlation coefficient to identify price channels, revealing trend direction, support, and resistance levels across different timeframes.
Explore complementary indicator rolesHow it works
The Smart Channel indicator dynamically calculates price channels by analyzing different lookback periods and applying statistical methods. It uses Pearson's correlation coefficient to determine the strength of linear relationships between price and time, selecting the most representative periods for short-term and long-term trends.
By computing linear regression parameters and standard deviations, the indicator generates midlines and channel boundaries that adapt to evolving market conditions. The calculation involves iterating through selected periods, measuring trend strength, and plotting channel lines that visually represent potential support and resistance zones.
Why it may be useful
The Smart Channel indicator provides traders with a sophisticated tool for understanding market dynamics by revealing trend direction and potential price movement boundaries. Its statistical approach offers more nuanced insights compared to traditional channel indicators, allowing traders to make more informed decisions based on quantitative analysis.
By dynamically adjusting to market conditions and offering both short-term and long-term perspectives, this indicator helps traders identify potential entry and exit points, assess trend strength, and anticipate possible breakouts or reversals across different trading timeframes.
When to explore it
The Smart Channel indicator is most effective in markets with clear directional trends and consistent price movements. It performs well in liquid markets with sufficient historical price data, such as major forex pairs, large-cap stocks, and prominent market indices where statistical relationships are more reliable.
Traders should utilize this indicator during periods of stable market conditions, avoiding its use during extreme volatility or significant fundamental economic events that can disrupt typical price patterns. It is particularly useful when combined with other technical analysis tools to confirm signals and provide comprehensive market insights.
Keep exploring
What we’ve verified
Access, alerts and repainting behaviour have not been independently verified for this indicator. Check the creator’s current publication and settings.
General descriptions and classifications are recovered research. Verified details above identify the specific checks we have completed. Check the creator’s current publication for later changes.