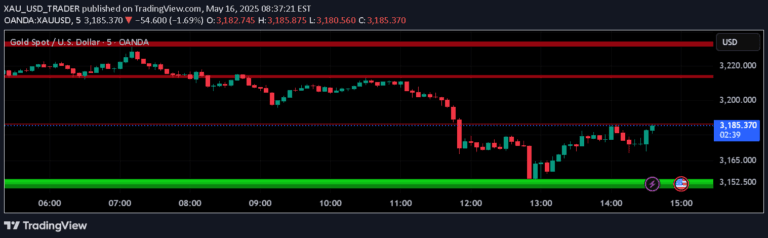
A multi-wave moving average system that uses Heikin Ashi and dynamic visualization to assess trend strength, direction, and potential price movement across different timeframes.
Explore complementary indicator rolesHow it works
The script generates multiple moving average waves using high-low rays and Heikin Ashi calculations across selected timeframes. It plots these waves with customizable visual styles including lines, solid waves, and dynamic waves that change color based on trend strength and price range.
The system creates a primary bias using Heikin Ashi high-low rays and a secondary bias from a higher timeframe, allowing traders to compare and analyze trend dynamics. The dynamic wave coloration provides an immediate visual representation of price movement relative to the established trend.
Why it may be useful
This signal helps traders understand complex market dynamics by providing a multi-layered view of price movement and trend strength across different timeframes. By visualizing waves and biases, traders can quickly assess whether the market is trending strongly, ranging, or potentially changing direction.
The adaptive visualization and customizable parameters allow traders to tailor the indicator to their specific trading style and market conditions. The ability to see both current and higher timeframe trends simultaneously provides a more comprehensive market analysis tool.
When to explore it
This signal is most effective in markets with clear trending characteristics, where price movements show consistent directional momentum. It works exceptionally well in liquid markets with sufficient price action, such as major forex pairs, stock indices, and popular cryptocurrency pairs.
Traders should utilize this signal when seeking to confirm trend strength, identify potential trend reversals, and gain a comprehensive view of market dynamics across multiple timeframes. It is particularly useful during periods of market transition or when attempting to distinguish between genuine trend moves and temporary price fluctuations.
Keep exploring
What we’ve verified
Access, alerts and repainting behaviour have not been independently verified for this indicator. Check the creator’s current publication and settings.
General descriptions and classifications are recovered research. Verified details above identify the specific checks we have completed. Check the creator’s current publication for later changes.