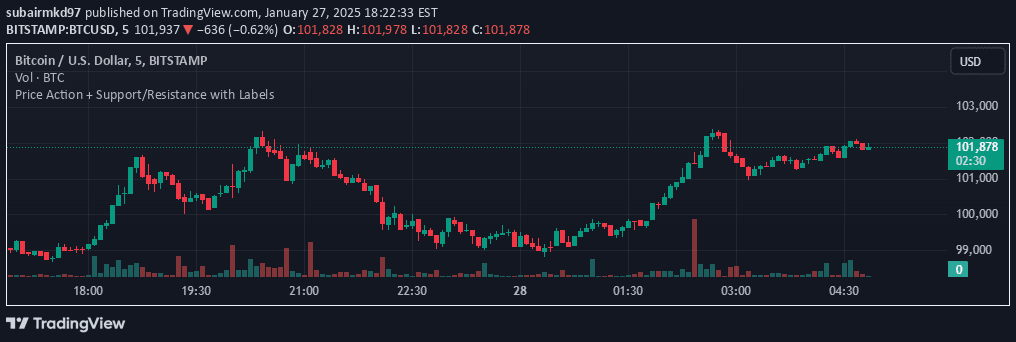
A dynamic TradingView tool that automatically identifies and displays support and resistance levels across multiple timeframes to help traders analyze market trends more effectively.
Explore complementary indicator rolesHow it works
The Dynamic S&R Tracker uses advanced algorithmic techniques to automatically detect key pivot highs and lows in the market. It analyzes price action across different timeframes and calculates critical support and resistance levels, dynamically adjusting its parameters based on current market conditions.
The tool simultaneously displays these levels on two different timeframes, using color-coded markers to distinguish between support (green) and resistance (red) zones. This automated process eliminates the need for manual level identification, providing traders with an efficient and precise method of understanding potential price movement boundaries.
Why it may be useful
Support and resistance levels are crucial for understanding market psychology and potential price reversal points. By automatically identifying these key levels, traders can make more informed decisions about entry and exit points, reducing the complexity of manual technical analysis.
The tool's ability to analyze multiple timeframes simultaneously offers traders a comprehensive market perspective, helping them understand both short-term and long-term trends. This broader view enables more strategic trading decisions and helps traders anticipate potential market movements with greater confidence.
When to explore it
The Dynamic S&R Tracker is most effective in markets with clear trending or ranging behaviors, where support and resistance levels play a significant role in price movement. It is particularly useful during periods of market consolidation or when traders are seeking to identify potential breakout or breakdown points.
Traders can benefit from this tool across various financial instruments, including stocks, forex, cryptocurrencies, and commodities. It is especially valuable for traders who want a systematic, data-driven approach to identifying key price levels without spending excessive time on manual analysis.
Keep exploring
What we’ve verified
Access, alerts and repainting behaviour have not been independently verified for this indicator. Check the creator’s current publication and settings.
General descriptions and classifications are recovered research. Verified details above identify the specific checks we have completed. Check the creator’s current publication for later changes.