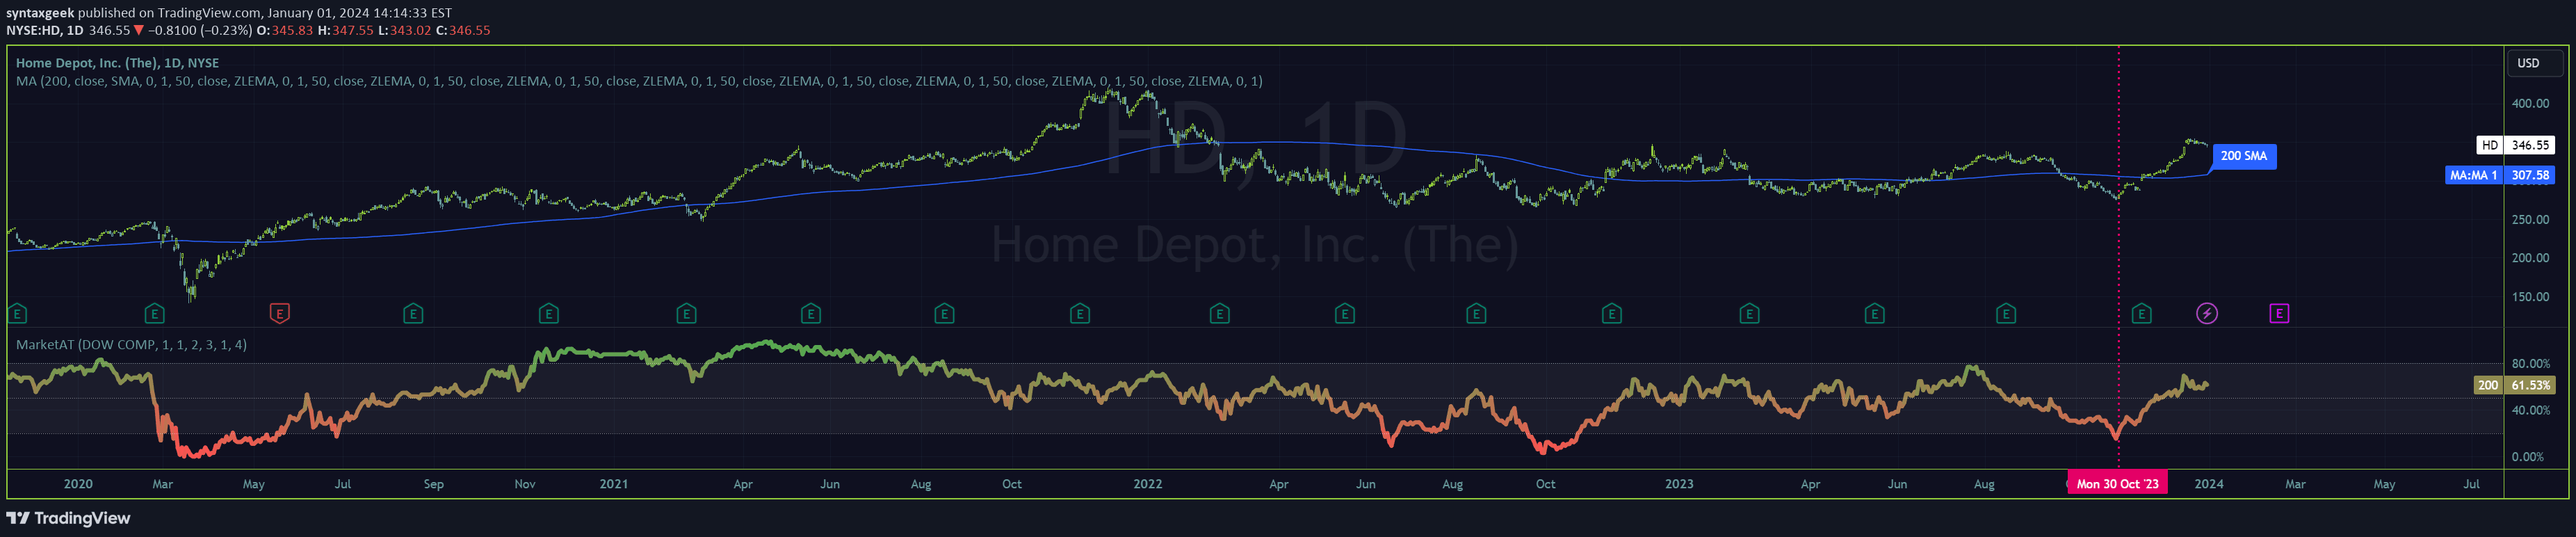
A comprehensive trading tool analyzing market stages through exponential moving averages, providing insights into trend direction, performance metrics, and potential market transitions.
Explore complementary indicator rolesHow it works
The signal uses exponential moving averages (EMAs) to track price movements and identify market stages by comparing the relationships between current price, fast EMA, and slow EMA. It calculates multiple EMAs with different lengths to create a comprehensive view of market dynamics, tracking how prices interact with these moving averages.
By establishing six distinct market stages - Recovery, Accumulation, Bull Market, Warning, Distribution, and Bear Market - the indicator provides a systematic approach to understanding trend progression. The system color-codes performance metrics and plots various EMAs on the chart, enabling traders to quickly assess the current market condition and potential trend shifts.
Why it may be useful
This signal offers traders a multi-dimensional view of market trends, moving beyond simple price analysis to provide contextual understanding of market stages and momentum. By integrating multiple performance metrics like 30-day, 90-day, and year-to-date changes, traders gain comprehensive insights into stock performance and potential trend directions.
The indicator's strength lies in its ability to transform complex market data into easily interpretable visual and numerical information. By color-coding changes and displaying key metrics in a table, traders can make more informed decisions, reducing emotional trading and enhancing strategic planning.
When to explore it
The signal is most effective in markets with clear trending characteristics, where prices are consistently moving in identifiable directions. It works best for traders seeking a holistic view of market conditions, particularly those interested in understanding broader market stages beyond simple price movements.
Traders should utilize this indicator when looking to identify potential trend reversals, assess market momentum, and gain insights into different market stages. It is particularly useful for intermediate to advanced traders who want a systematic approach to trend analysis and want to combine multiple technical indicators for more robust decision-making.
Keep exploring
What we’ve verified
Access, alerts and repainting behaviour have not been independently verified for this indicator. Check the creator’s current publication and settings.
General descriptions and classifications are recovered research. Verified details above identify the specific checks we have completed. Check the creator’s current publication for later changes.