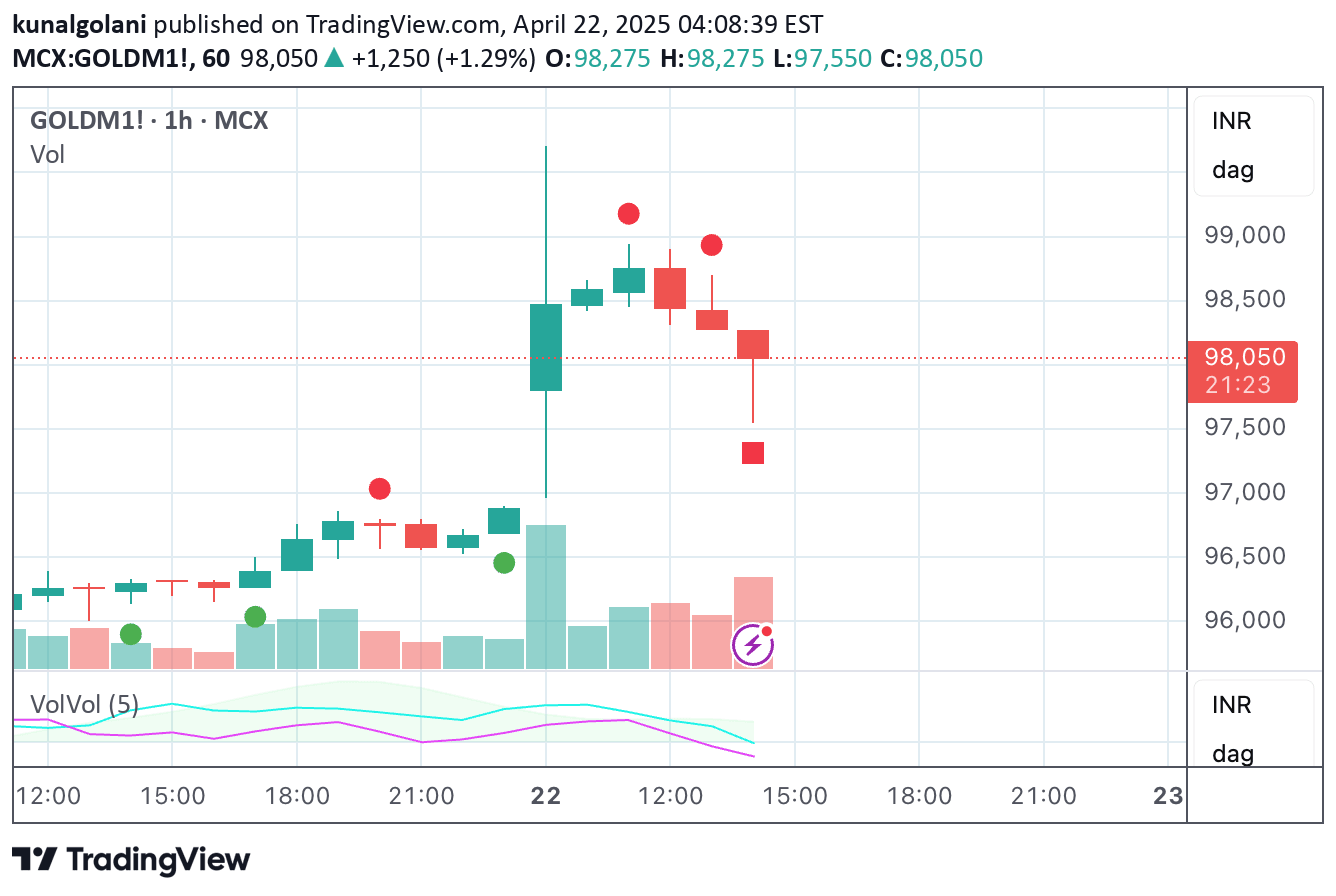
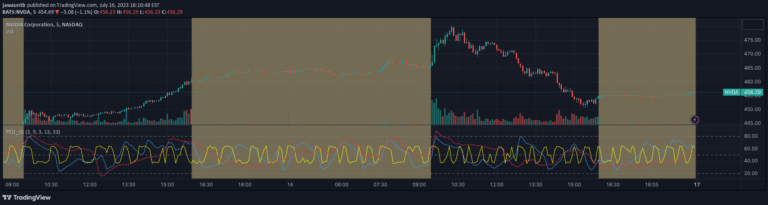
A dynamic oscillator that measures market volatility by transforming standard deviation into a normalized 0-100 scale, helping traders identify potential market turning points and volatility extremes.
Explore complementary indicator rolesHow it works
The Standard Deviation Oscillator calculates volatility by measuring price dispersion around a moving average using a rolling window method. It computes the standard deviation of closing prices over a specified period (default 20 periods), then normalizes these values to a 0-100 scale for easy interpretation.
The oscillator dynamically adjusts its color and visualization based on current volatility levels, with red indicating high volatility, green showing low volatility, and blue representing normal market conditions. By transforming complex statistical calculations into an intuitive visual tool, traders can quickly assess market volatility and potential trend reversals.
Why it may be useful
The Standard Deviation Oscillator provides traders with a sophisticated method to quantify and visualize market volatility, which is crucial for understanding potential market dynamics and risk management. By presenting volatility as a normalized oscillator, it helps traders make more informed decisions about market entry, exit, and position sizing.
This indicator is particularly valuable because it transforms complex statistical measurements into an easily interpretable format, allowing traders to quickly assess market conditions without deep mathematical knowledge. Its adaptive calculation and customizable thresholds make it a versatile tool for identifying potential market turning points across different trading instruments and timeframes.
When to explore it
The Standard Deviation Oscillator is most effective when used on timeframes of 1-hour, 4-hour, and daily charts, where its volatility measurements can provide meaningful insights into market behavior. Traders should prioritize using this indicator in conjunction with trend-following tools and price action confirmation to validate its signals.
It is particularly useful during periods of market uncertainty, helping traders scale position sizes inversely to volatility levels and identify potential breakout or consolidation scenarios. By setting custom overbought and oversold levels, traders can adapt the indicator to specific market conditions and individual trading strategies.
Keep exploring
What we’ve verified
Access, alerts and repainting behaviour have not been independently verified for this indicator. Check the creator’s current publication and settings.
General descriptions and classifications are recovered research. Verified details above identify the specific checks we have completed. Check the creator’s current publication for later changes.