A dynamic Fibonacci-based indicator that identifies market strength and weakness by analyzing price positioning relative to 50% retracement levels across multiple timeframes.
Explore complementary indicator rolesHow it works
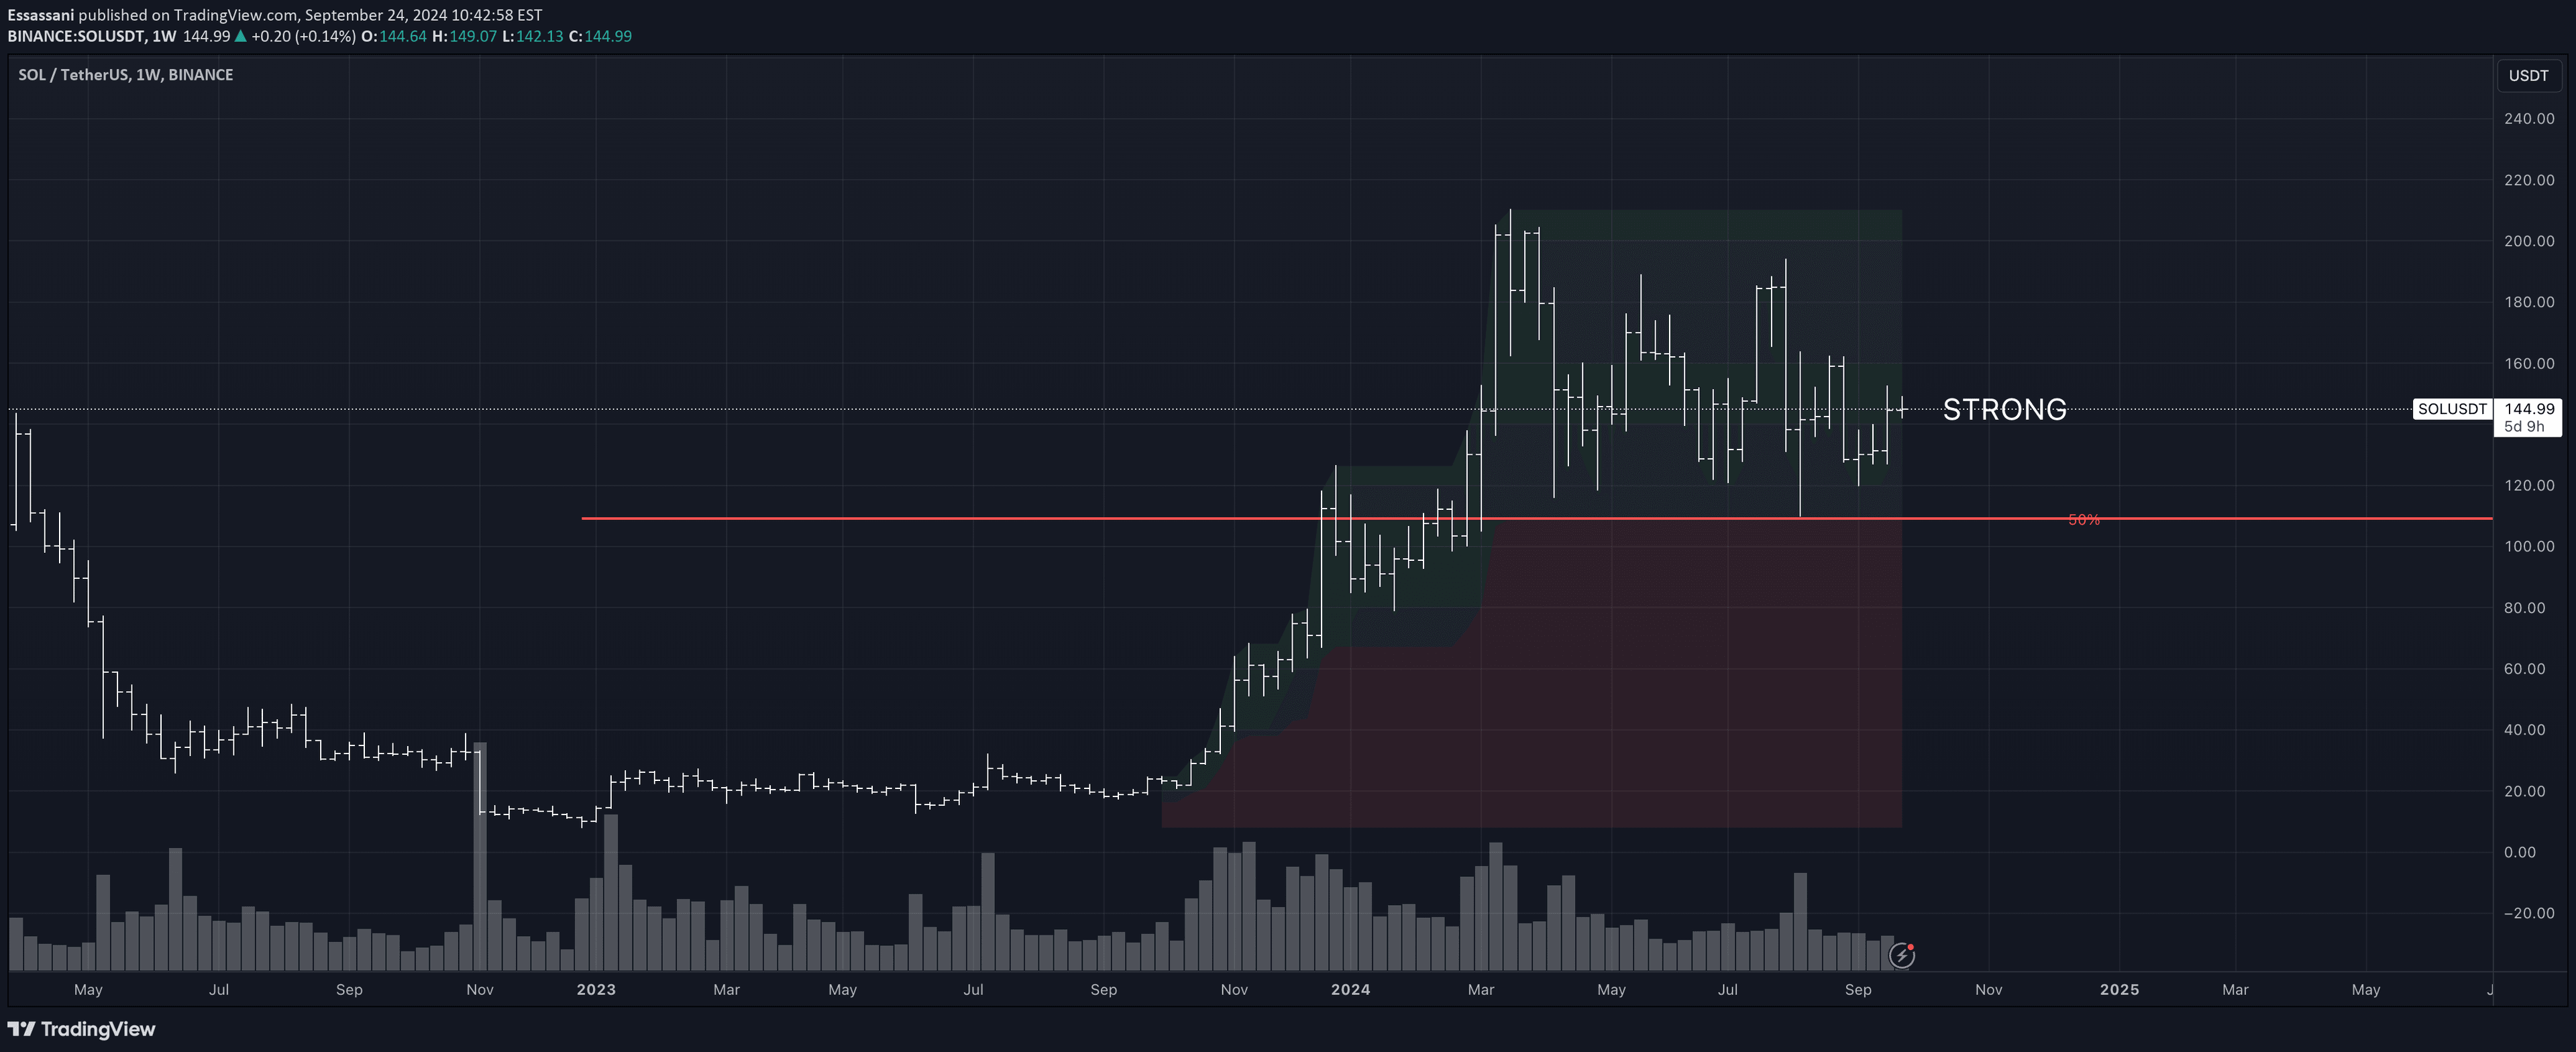
The Strength/Weakness Indicator calculates 50% Fibonacci retracement levels by identifying the highest high and lowest low within customizable time periods. Traders can analyze up to two distinct retracement levels simultaneously, allowing for multi-timeframe comparison and dynamic market sentiment assessment.
The indicator automatically labels market conditions as 'STRONG', 'WEAK', 'VERY STRONG', or 'VERY WEAK' based on the price's position relative to these critical retracement levels. By comparing price action across different timeframes, traders gain insights into potential trend continuations or reversals.
Why it may be useful
This indicator provides traders with a sophisticated tool for understanding market psychology and momentum by leveraging the critical 50% Fibonacci retracement level. It offers real-time insights into market strength, helping traders make more informed decisions about potential trend continuations or reversals.
By enabling cross-timeframe validation and providing dynamic visual representations, the indicator helps traders identify key support and resistance zones. Its adaptability across different trading styles makes it a valuable resource for both short-term and long-term trading strategies.
When to explore it
The Strength/Weakness Indicator is most effective when traders want to assess market momentum and identify potential trend changes across multiple timeframes. It works exceptionally well during trending markets where clear support and resistance levels can be established and validated.
Traders should use this indicator in conjunction with other technical analysis tools to confirm signals and make more comprehensive trading decisions. It is particularly useful when analyzing assets with significant price movements and when seeking to validate trend strength across different time periods.
Keep exploring
What we’ve verified
Access, alerts and repainting behaviour have not been independently verified for this indicator. Check the creator’s current publication and settings.
General descriptions and classifications are recovered research. Verified details above identify the specific checks we have completed. Check the creator’s current publication for later changes.