YOUR INDICATOR RESEARCH STARTS HERE

Find the right indicator.
Understand what it does.

Explore 11,183 indicators. Filter beyond the obvious.
Discover the tools that fit the way you trade.

THE INDICATOR LIBRARY

Results for “weakness”

11,183 tools to explore

102 indicators matching your filters
Save search
TrendMomentumEditor’s pick

Divergence Indicator (any oscillator)

by yatrader2

A versatile divergence indicator that identifies potential trend reversals by comparing price action with an oscillator's momentum, adaptable to multiple technical indicators.

Separate pane · unverifiedDay Trading · Swing Trading
Explore
10.4Klikes218.8Kviews153comments
Save
TrendMomentumEditor’s pick

Divergence-Support/Resistence

by Trendoscope

A trading signal that identifies support and resistance levels using zigzag patterns, divergence detection, and oscillator analysis to highlight potential trend reversals and market momentum shifts.

Main price chart · unverifiedDay Trading · Swing Trading
Explore
3.6Klikes149.2Kviews39comments
Save
TrendEditor’s pick

Monthly Returns in PineScript Strategies

by QuantNomad

A custom trading tool that generates monthly and yearly performance tables for trading strategies, helping traders analyze historical strategy performance and identify key periods of success or weakness.

Separate pane · unverifiedSwing Trading
Explore
3.2Klikes67.8Kviews78comments
Save
VolumeSignalOscillator

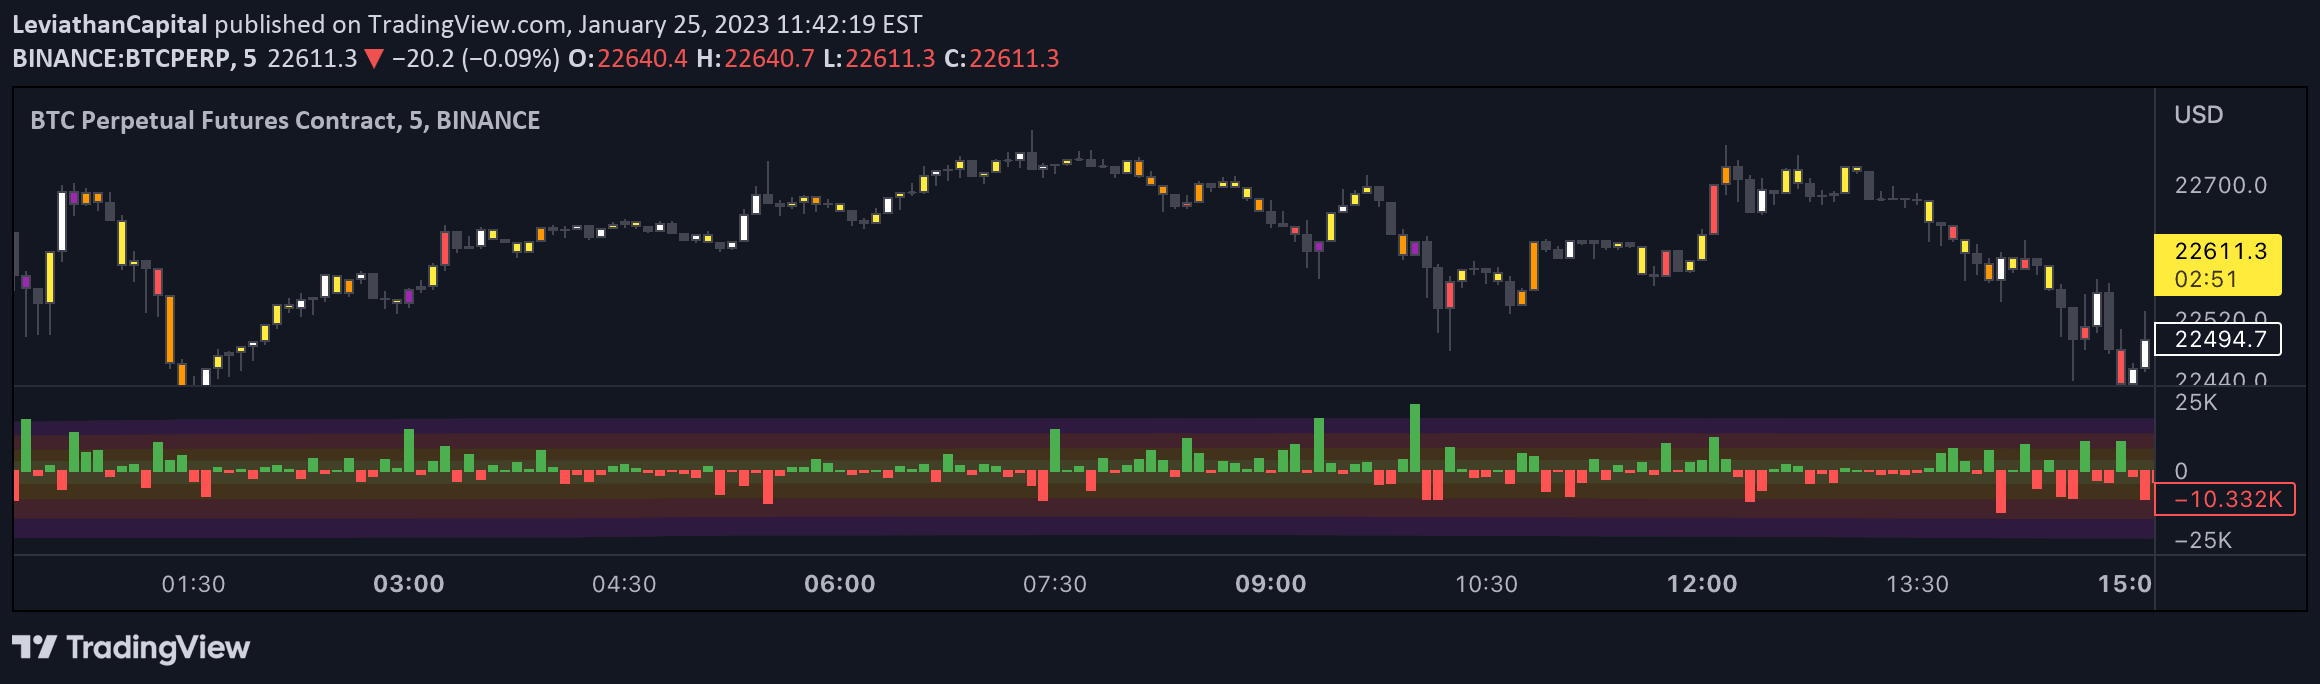
Open Interest Delta - By Leviathan

by LeviathanCapital

Open Interest Delta indicator tracks changes in open/unsettled positions, visualizing net increases or decreases through a heatmap and colored candles to help traders analyze market positioning.

Separate pane · unverifiedScalping · Day Trading
Explore
2Klikes49.6Kviews12comments
Save
OscillatorSignalTrend

Candle Breakout Oscillator [LuxAlgo]

by LuxAlgo

A market state oscillator that identifies trend strength and weakness through price action breakouts, revealing bullish, bearish, and sideways market conditions across three main plots.

Separate pane · unverifiedScalping · Day Trading
Explore
1.4Klikes25.8Kviews5comments
Save
OscillatorSignalVolume

Volume Divergence Indicator

by cyatophilum

A volume-based indicator that identifies potential price reversals by analyzing volume trends, divergences, spikes, and contractions to help traders detect market shifts.

Separate pane · unverifiedScalping · Day Trading
Explore
1.4Klikes39.9Kviews22comments
Save
LevelsTrendVolume

Fibonacci Volume Profiles [AlgoAlpha]

by AlgoAlpha

A dynamic Fibonacci-based volume profile indicator that reveals market structure by integrating retracement levels with volume distributions, helping traders identify high-probability support and resistance zones.

Main price chart · unverifiedScalping · Day Trading
Explore
987likes14Kviews5comments
Save
LevelsMomentumOscillator

RSI Chart Levels

by RSI_Trading_Concepts

RSI Chart Levels overlay helps identify support/resistance zones and real-time divergence by tracking price movements against RSI indicator fluctuations.

Separate pane · unverifiedScalping · Day Trading
Explore
872likes20.9Kviews9comments
Save

Likes, views, and comments are historical TradingView snapshots. They describe attention, not trading performance.

START WITH A QUESTION

A little less searching.
A lot more understanding.

Tell DeepAlpha what you need. Get an explanation, a shortlist,
and a direct path to the indicators behind it.

Ask DeepAlpha